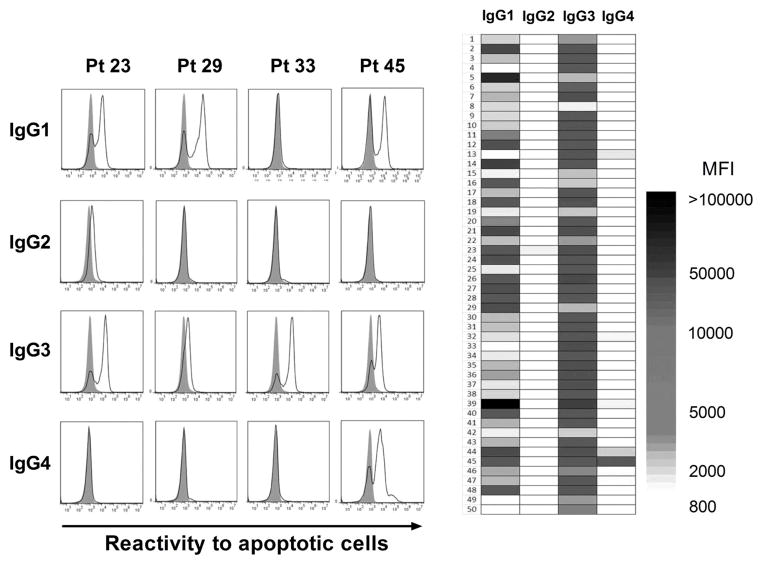
Figure 5. Subclasses of serum IgG reactive to apoptotic cells.
(A) Example of subclass analysis by flow cytometry of IgG reactive to apoptotic Jurkat cells purified from 4 representative pre-transplant serum specimens, using secondary antibodies specific to IgG1 ~ IgG4. Filled gray histograms show background reactivity obtained with secondary antibodies alone. IgG1 ~ IgG4 reactivity to apoptotic Jurkat cells is depicted as solid line histograms. (B) Heat-map representation of IgG1 ~ IgG4 reactivity to apoptotic cells for the 50 most reactive serum samples. The shade of gray corresponds to the level of reactivity (MFI) as reported on the scale.

