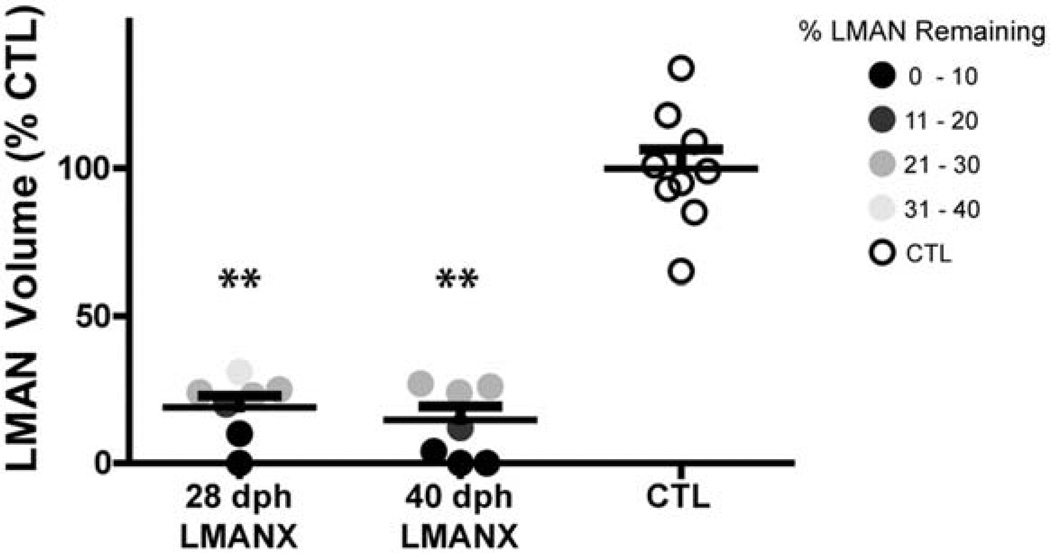
Figure 4. Confirmation of LMAN ablation.
All birds in the 28- and 40-dph LMANX groups had significantly smaller LMAN volume compared to the CTL group (all volumes calculated as a percentage of the mean LMAN volume in the CTL group). Long and short bars indicate mean and S.E.M., respectively. Asterisks represent significance values of p ≤ 0.01 (**).

