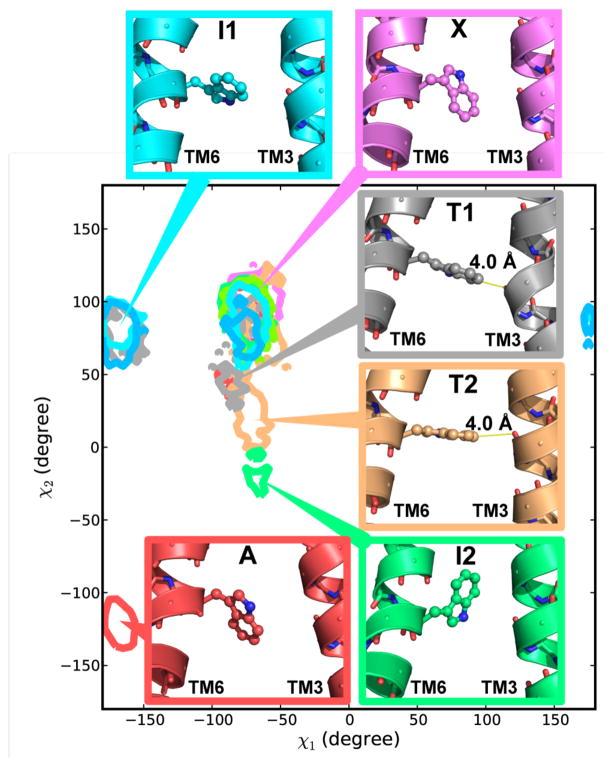
Fig. 4.
Trp2466.48 χ1 and χ2 distributions and their representative conformations. The regions enclosed by the contour lines have a normalized probability higher than 0.005. The shortest heavy atom distance between the Trp2466.48 side chain and the TM3 backbone is labeled for the states T1 and T2. Table S2 contains the details of each simulation regarding the fraction of time spent in each rotameric state. The original scatter plot is shown as Fig. S5. The color scheme is consistent with Fig. 2.

