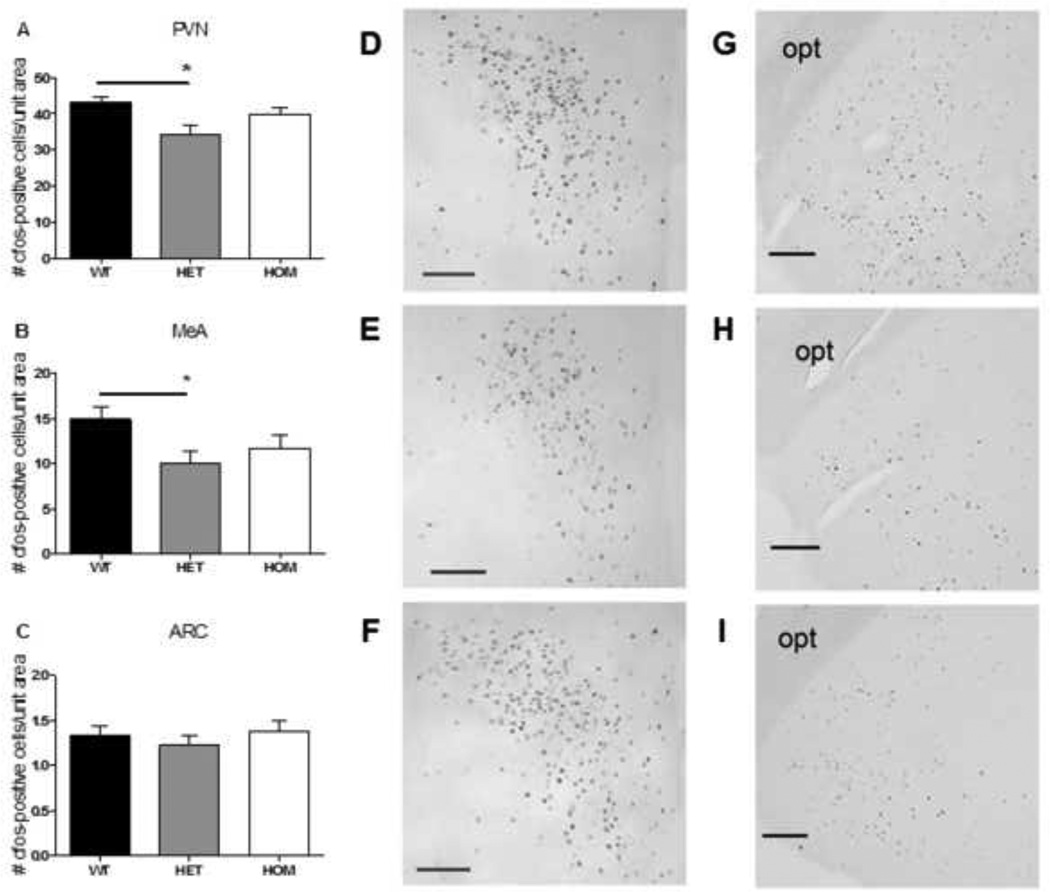
Figure 6. The c-Fos response to acute restraint in the PVH and MeA was blunted by Mc4r loss-of-function.
The c-Fos response to acute restraint was significantly blunted in the PVH (a) and MeA (b), but not in the ARC (c), of HET rats compared to their WT littermates (ANOVA with Tukey’s posthoc, p< 0.01). Data presented as mean ± S.E.M. * P < 0.05 relative to WT littermates. n = 15 per group. d–f) representative images of PVH c-Fos in WT (d), HET (e), and HOM (f) rats at 2-h following the onset of restraint; scale bar = 100 µM. g–i) representative images of MeA c-Fos in WT (g), HET (h), and HOM (i) rats at 2-h following the onset of restraint; scale bar = 200 µM; opt = optic tract.

