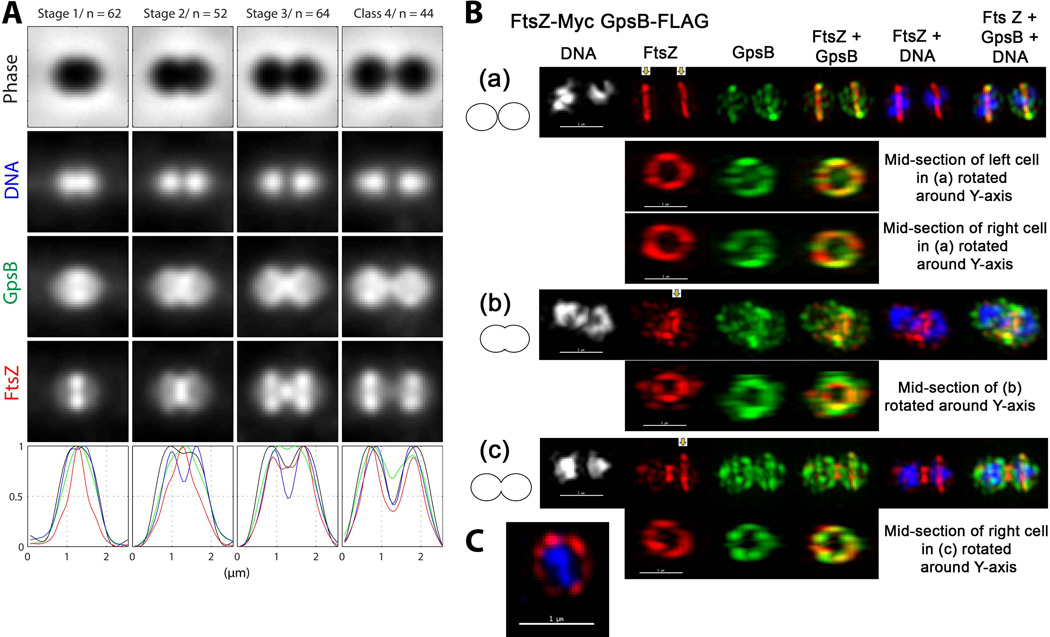
Fig. 3.
GpsB and FtsZ have different, but overlapping, localization patterns at each stage of cell division. (A) Averaged images and fluorescence intensity traces of strain IU6964 (ftsZ-Myc gpsB-FLAG) grown to mid-exponential phase in BHI broth and processed for dual-protein 2D IFM and DAPI labeling as described in Experimental procedures. Cells were binned into division Stages 1–4, and images from the indicated number of cells (n) from two independent biological replicates were quantified using the graphical user interface program (GUI) described in Experimental procedures. Row 1, cell shapes from phase-contrast images; row 2, nucleoid locations from DAPI labeling; row 3, GpsB locations from IFM; row 4, FtsZ locations from IFM; row 5, normalized average fluorescence intensity distributions along the horizontal cell axis for each channel (black, phase image; blue, DNA; green, GpsB; red, FtsZ). (B) Representative 3D-SIM IFM images of strain IU6964 at different division stages (scale bar = 1 µm). DNA (DAPI stained image) are false-colored white or blue in column(s) 1 or 5 and 6, respectively. FtsZ and GpsB are pseudo-colored as red and green, respectively, and overlapping FtsZ and GpsB signal is represented by yellow. Cartoons at the left of images depict stage of cell division. (a) First row; transverse section of separated pre-divisional cells, corresponding to stage 1 in A. Second and third rows, mid-sections containing FtsZ and GpsB of the left and the right cells were selected (arrows) with the softWorx program and rotated around the Y-axis to show distributions and overlap of FtsZ and GpsB in midcell rings (see Movie S1). (b) First row; mid-divisional cell corresponding to Stage 2 in A with segregating DNA still in the septum of a contracting FtsZ ring. Bottom row; mid-section of the constricting septum (arrow) rotated around the Y-axis. (c) Top row; transverse section of a late-divisional cell corresponding to Stage 4 in A. Bottom row; mid-section of right daughter cell (arrow) rotated around the Y-axis showing that although GpsB is diffusely distributed throughout the daughter cells, a distinct equatorial ring of GpsB has formed where FtsZ is located. Images shown are representative of >30 examined cells in different division stages from two biological replicates. (C) 3D-SIM image of a vertically standing cell expressing FtsZ-Myc (pseudo-colored red) in a non-uniform “bead-like” ring around a nucleoid core (pseudo-colored blue) (scale bar = 1 µm).

