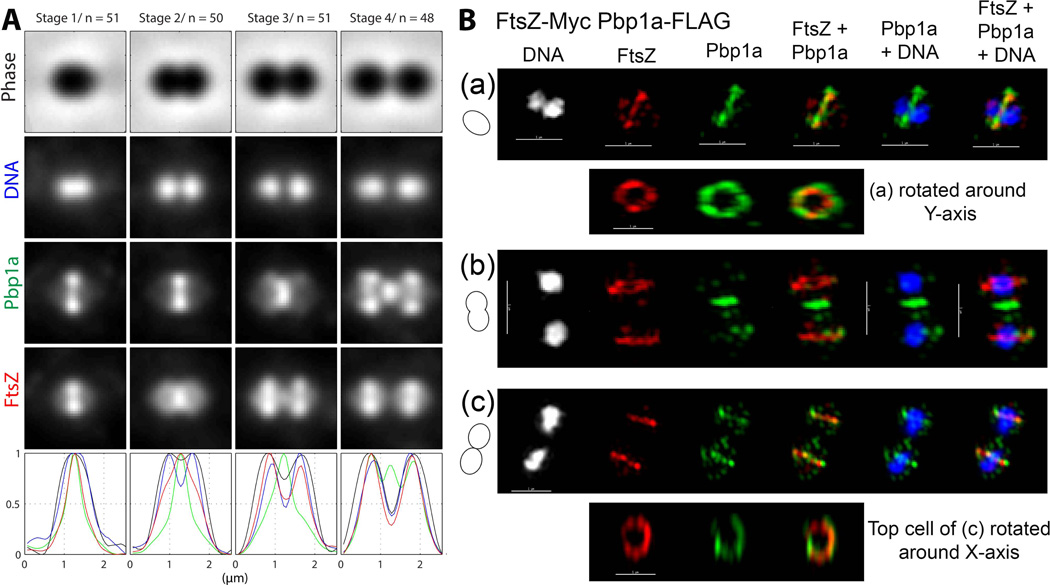
Fig. 5.
Pbp1a localization resembles that of Pbp2x and remains at division septa after most FtsZ has migrated to equators of daughter cells. (A) Averaged images and fluorescence intensity traces of strain IU6976 (ftsZ-Myc pbp1a-FLAG) grown to mid-exponential phase in BHI broth and processed for dual-protein 2D IFM and DAPI labeling (see Experimental procedures). Cells from two independent biological replicates were binned into division stages and images were averaged and intensity traces graphed as described for Figure 3A and in Experimental procedures, except that row 3 and green color correspond to Pbp1a. (B) Representative 3D-SIM IFM and DAPI images of strain IU6976 at different division stages (scale bar = 1 µm). Pseudo-coloring is similar to Figure 3B, except green corresponds to Pbp1a. Cartoons at the left of images again depict stage of cell division. (a) First row; transverse section of a pre-divisional cell corresponding to Stage 1 in A showing co-localization of FtsZ and Pbp1a. Second row; a section in the midcell containing FtsZ and Pbp1a was selected and rotated around the Y-axis to show that Pbp1a, like Pbp2x (Fig. 4B (a)), forms a larger concentric ring around the FtsZ ring (see text and Movie S3). (b) Traverse section of late-divisional cell corresponding to Stage 4 in A showing that Pbp1a, like Pbp2x (Fig. 4B(c), remains at septa after FtsZ has migrated to equators of daughter cells. Initial migration of Pbp1a to equators can also be seen. (c) First row, transverse section of newly divided cells corresponding to Stage 1 in A showing co-localization of FtsZ and most of Pbp1a at equators of daughter cells. Second row, section of the midcell of upper daughter cell rotated around the X-axis. Images shown are representative of >30 examined cells at various division stages obtained from two biological replicates.

