Fig. 7.
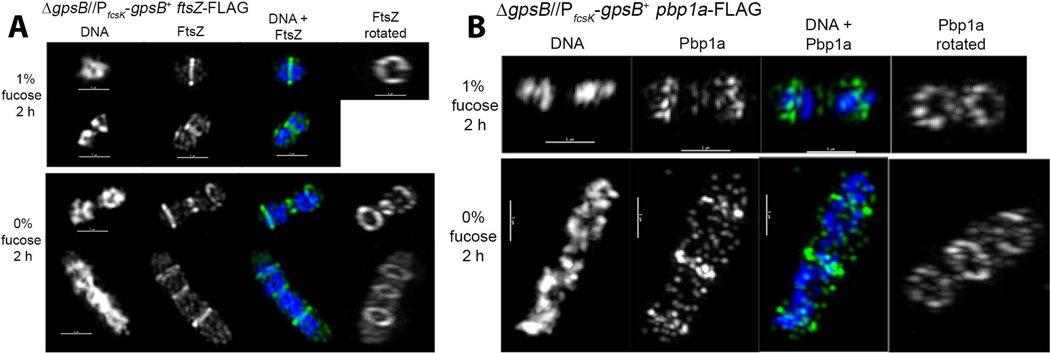
Presence of multiple FtsZ and PBp1a rings in elongated cells depleted of GpsB. Strains IU6944 (ΔgpsB//PfcsK-gpsB+ ftsZ-FLAG) (A) and IU5980 (ΔgpsB//PfcsK-gpsB+ pbp1a-FLAG) (B) were depleted for GpsB for 2 h as described for Fig. 1 and in Experimental procedures. DAPI staining and 3D-SIM IFM of cells expressing GpsB (1% fucose) and cells depleted of GpsB (0% fucose) were performed as described in Experimental procedures. (A) Representative FtsZ localization upon GpsB depletion. DNA is pseudo-colored white or blue in column 1 or 3, respectively. FtsZ is pseudo-colored white or green in columns 2 and 4 or 3, respectively. Images are rotated in column 4 to display FtsZ rings (see Movie S5). (B) Representative Pbp1a localization upon GpsB depletion. The color scheme is as in A, except Pbp1a is now pseudo-colored white or green in column(s) 2 and 4 or 3, respectively (see Movie S6). Scale bar = 1 µm. Images shown are representative of 8 cells examined by 3D-SIM and hundreds of cells observed by 2D IFM (see Fig. S8 and S10).

