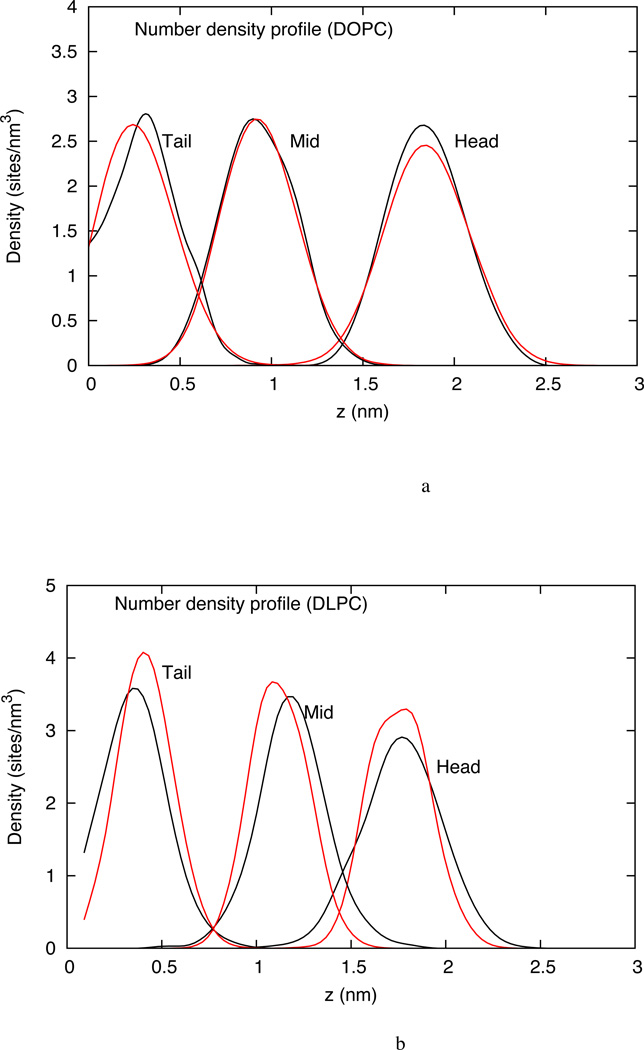
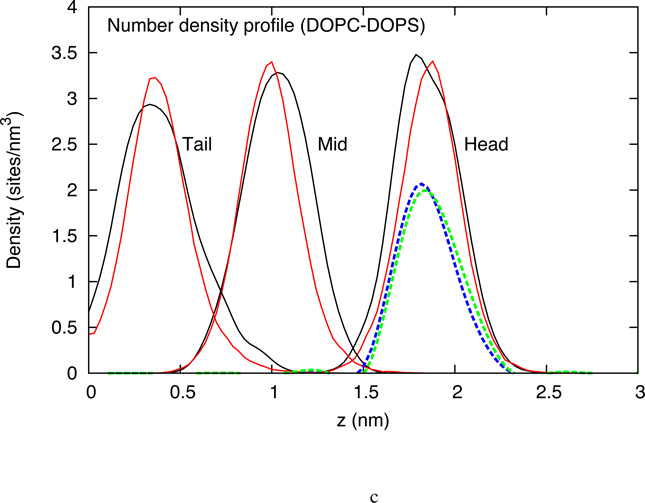
Figure 7.
(a) z-density profile for three CG sites from the atomistic simulation (black) and the CG simulation (red) of DOPC HCG model (b) z-density profile for three CG sites from the atomistic simulation (black) and the CG simulation (red) of DLPC HCG model (c) z-density profile for three CG sites from the atomistic simulation (black) and the CG simulation (red) of DOPC-DOPS HCG model. The blue and green dashed lines represent the z-density profile of the DOPC and DOPS head group respectively. No heterogeneity with respect to distribution in z-dimension is observed.


