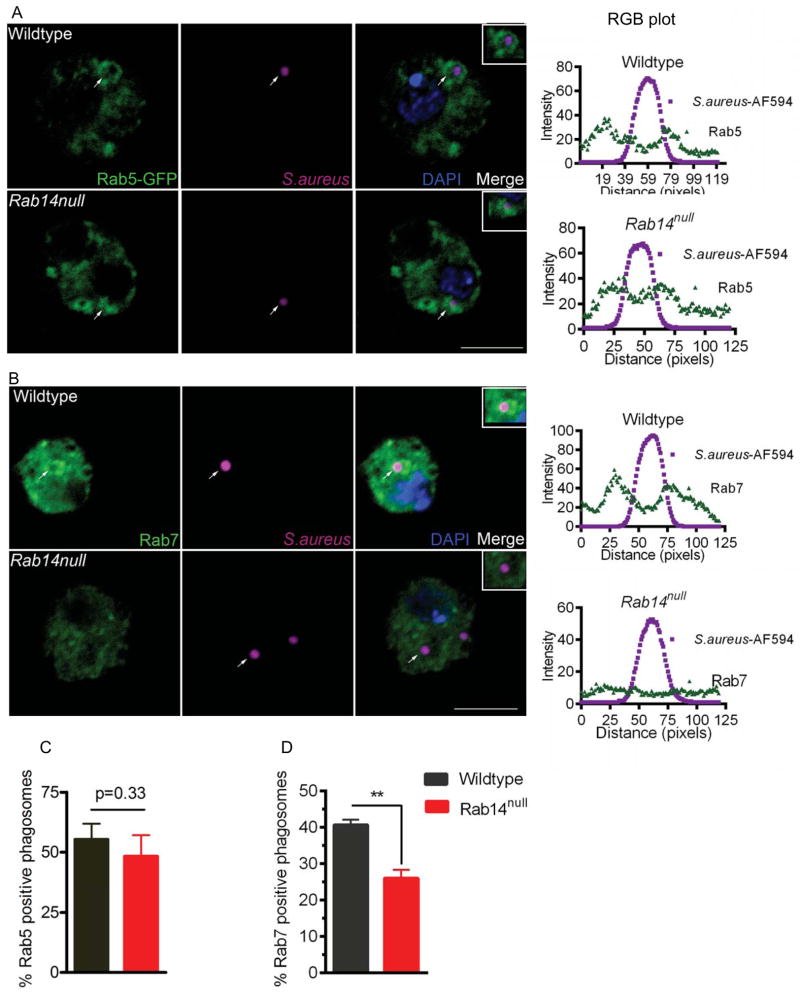
Figure 3. Rab14 mutant phagosomes demonstrate reduced recruitment of a late phagosomal marker.
(A) Wildtype and Rab14 mutant phagosomes show comparable recruitment of the early endosomal marker Rab5. Hemocytes expressing Rab5-GFP (hmlGAL4) were bled out and fixed from wildtype and Rab14 mutant larvae after a 20 min pulse with S. aureus conjugated to AF-594 (magenta). Hemocytes were evaluated for Rab5 (green) recruitment onto phagosomes. The merged image includes Rab5 (green), S. aureus (magenta) and DNA/DAPI (blue). Enrichment of marker-associated fluorescence in the vicinity of bacteria was considered positive for recruitment. An RGB plot for a 120 pixel line across the phagosome was plotted using image analysis software (ImageJ). The arrows on the merged image indicate the phagosome of interest utilized to make the RGB plot. (B) Rab14 mutant phagosomes show a reduced presence of Rab7. A 20 min pulse with S. aureus-AF-594 followed by a 10 chase with Schneider’s media was given to wildtype and Rab14 mutant hemocytes which were then immunostained for Rab7. Rab7 recruitment onto the phagosomes was analyzed. (C, D) Percentages of phagosomes showing recruitment of (C) Rab5 and (D) Rab7 are plotted for wildtype and Rab14null. The experiments were conducted 3 times with 10–12 larvae in each experiment. Images were obtained using confocal microscopy and a total of 70–90 phagosomes were examined for quantification. Error bars indicate standard error of the mean (SEM), n=3. Data was analyzed by two tailed, paired t-test. ** p<0.01. Scale bar, 5μm

