
Figure 1.
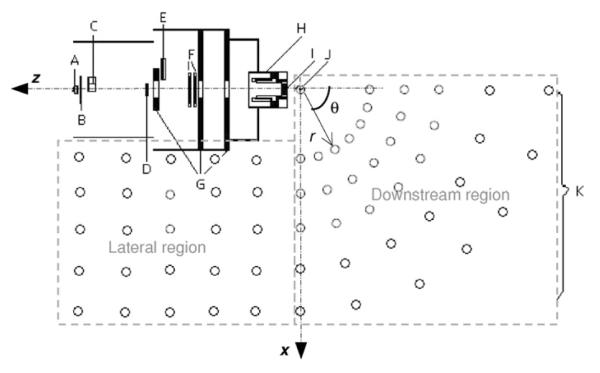
Monte Carlo model of a scattered treatment nozzle. The proton beams enter the nozzle from the left through a vacuum window (A), a beam profile monitor (B), a range-modulator wheel (C), a second scatterer (D), a range shifter assembly (E), backup and primary beam monitors (F), shielding plates (G), a snout (H), and a final collimator or aperture (I). The location of the isocenter is indicated by J. The open circles outside the nozzle represent neutron receptors (K). The position of the neutron receptor is determined by the distance from the isocenter (r) and the angle relative to the central axis (θ) in the downstream region, and the coordinates (x, z) in lateral regions, with the isocenter being the origin. The figure is not to scale.