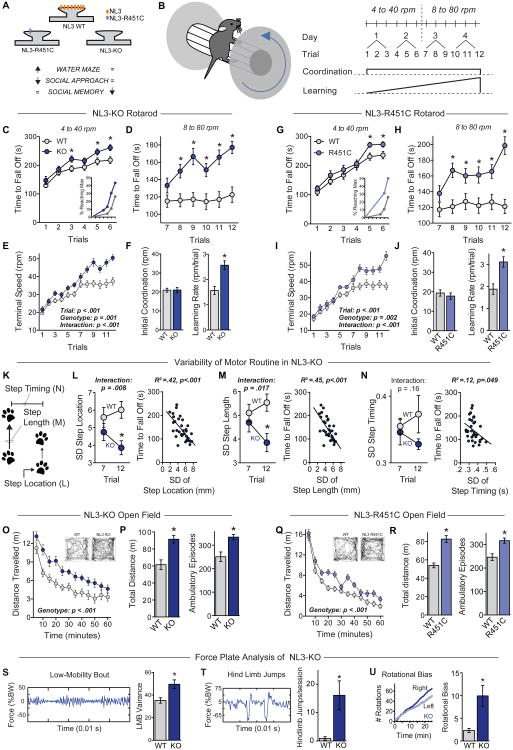
Figure 1. ASD-associated NL3 mutations enhance repetitive and stereotyped behaviors.
(A) Summary of behavioral heterogeneity in ASD mouse models produced by NL3 mutations.
(B) Illustration of a mouse on a rotarod (left), and diagram of the rotarod testing protocol (right). The effects of motor coordination and learning are illustrated below the protocol.
(C-F) Performance of littermate wild-type (WT, n=22) and NL3-KO mice (n=23) on the accelerating rotarod. Time to fall off is presented at 4 to 40 rpm (C) and 8 to 80 rpm (D); the terminal speed of rotation (E) was used to calculate initial coordination and learning rate (F). Inset in C shows percentage of mice reaching maximum performance time (300 s) plotted as a function of trial.
(G-J) Same as C-F, but comparing WT (n=19) and NL3-R451C mutant mice (n=16).
(K-N) Quantitative video analysis of acquisition rates of repetitive motor routines during rotarod training (n=8 WT and 9 NL3-KO mice). K illustrates the analyzed parameters: step location, step length, and step timing. L-N depicts the standard deviation (SD) of step location (L), step length (M), and time between steps (N) calculated on trials 7 and 12 during rotarod training to measure variability in the motor routine (left panels), as well as the correlation with time to fall off the rotarod (right panels).
(O & P) Behavior of WT and NL3-KO mice in an open field test, showing time course of activity across the entire session (O), as well as total distance travelled and the number of ambulatory episodes (P). Insets depict movement path of individual mice 10-20 min after the test begins.
(Q & R) Open field activity for WT and NL3-R451C mice.
(S-U) Analysis of stereotyped behaviors by measurements of the force plate variance as percentage of body weight (%BW) during low-mobility bouts (LMB, S), hind limb jumps (T), and rotational bias during locomotion (U) in WT (n=10) and NL3-KO mice (n=12).
Data are means + SEM; *significant difference between groups (ANOVA). Also see Table S1 and Figure S1.

