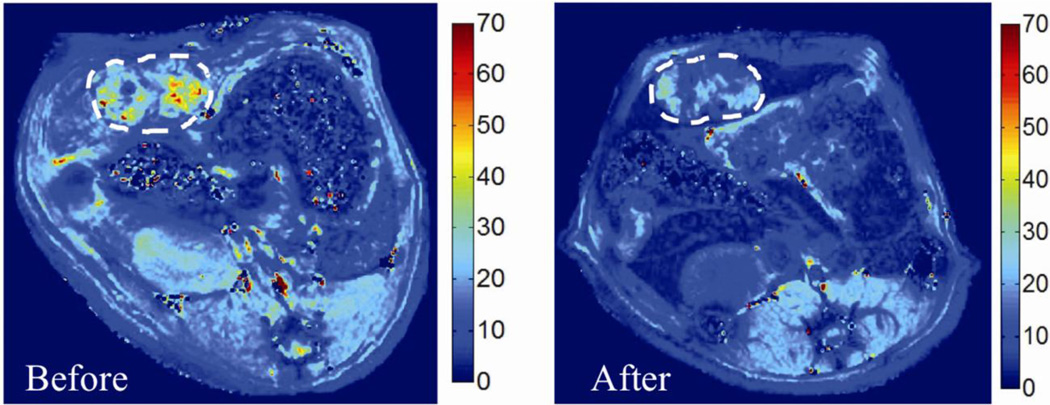
Figure 3.
Representative axial MR images of N1-S1 rat hepatoma obtained at 7T before and after nanoablation, in which the color scale corresponds to the T2* value in miliseconds (ms). SPIO uptake can be visualized by diminished color intensity (measured in ms) in the tumor (as denoted by dashed lines) and surrounding liver in the post-treatment image relative to the pre-treatment image.

