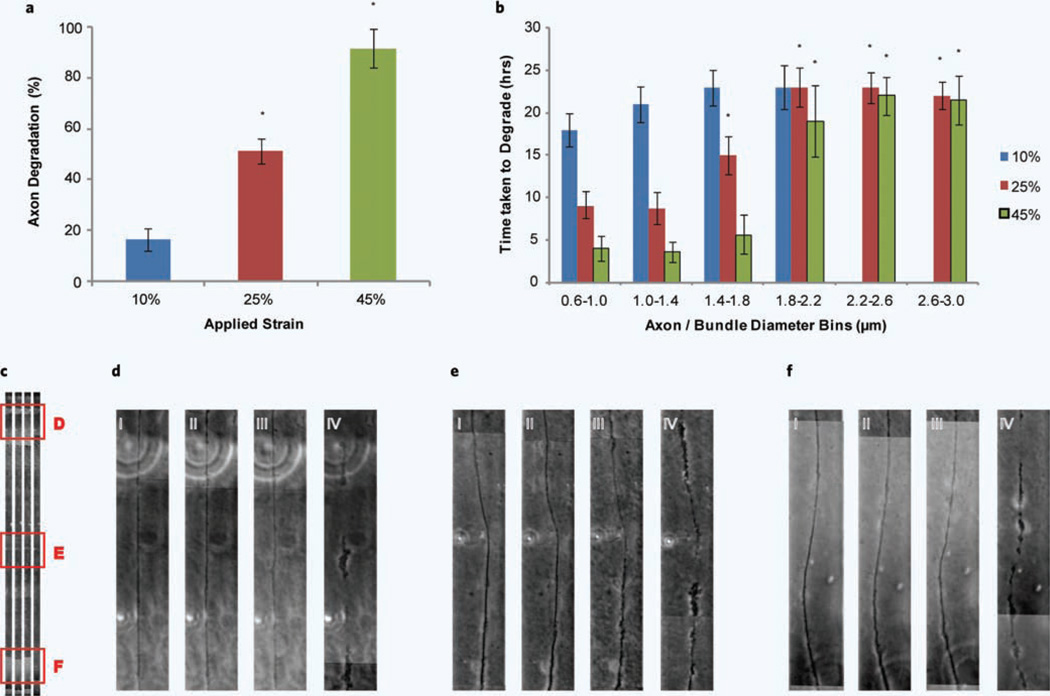
Figure 4.
Axonal degradation following a uniaxial strain injury. (a) Axonal degradation was assessed at 24 hours following uniaxial strain injury with respect to 10%, 25% and 45% applied strain. *P < 0.05 compared to 10% strain (number of experiments = 12). (b) The time taken to degrade was monitored with respect to axon diameter. The diameters of axons were grouped into 0.4 µm bins from 0.6 µm to 3.0 µm. *P < 0.05 compared to 0.6 µm-1.0 µm (number of experiments = 12). (c) An example of an axon along the full length of the strain region undergoing degradation over time. Three different positions are highlighted and shown in higher magnification in d–f. Position d and f correspond to the regions of lowest strain and e the region of highest strain. (d–f) (i) axon before injury, (ii) axon immediately following injury, (iii) 18 hours post injury and (iv) 20 hours post injury.

