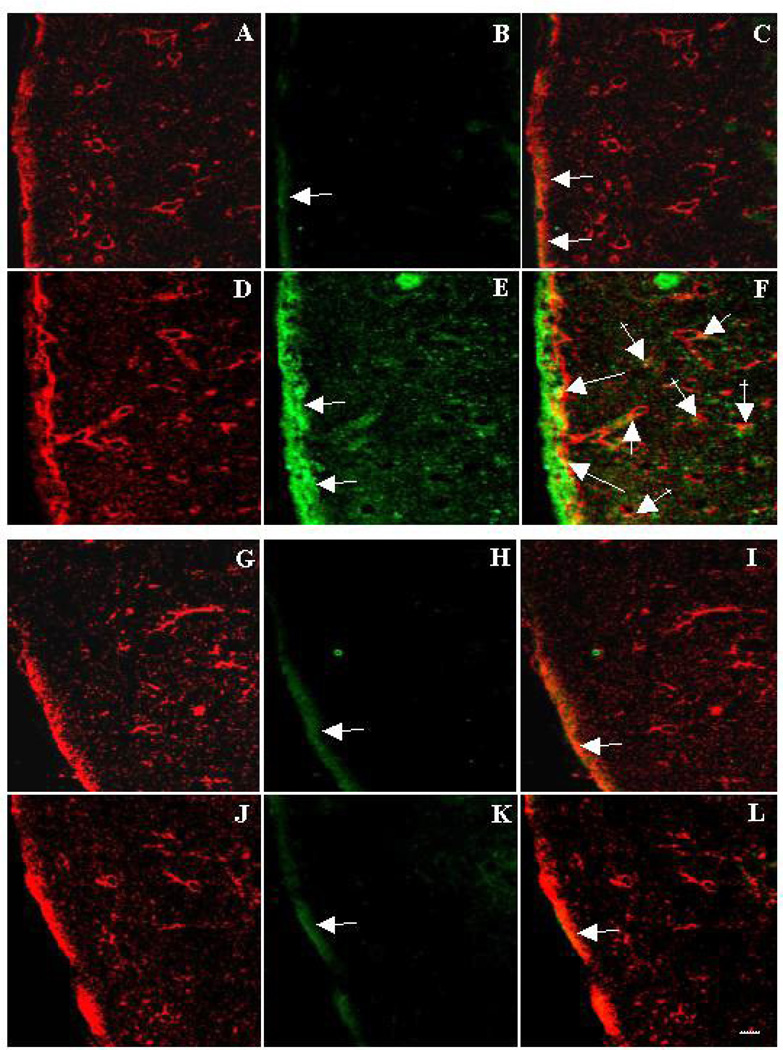
Figure 4.
Immunohistochemistry of inducible nitric oxide synthase (iNOS) and glutamine synthatase (GS) in cerebral cortex of mice. Figures A–F were prepared from WT mice, while G–L are from Tg mice. Green represents iNOS and red is GS. Control sections from WT mice showing GS (A), iNOS (B) and merged image (C). Note a faint green fluorescence (B) indicating a minimal amount of iNOS expression (arrow), which is mostly associated with the pial surface, and partly colocalizes with GS (C) (orange, arrows). Section from TAA-treated WT mice shows GS (red, D) and iNOS (green, E) and a merged image (F). A marked increase in iNOS expression is noted (E, arrows), which strongly colocalizes with GS (orange, F) in pial regions (long arrows), around blood vessels (short arrows) and in the neuropil (crossed arrows), indicating that the astrocytic iNOS expression is upregulated in TAA-treated WT mice. Sections from control Tg mice (G–I) and TAA-treated Tg mice (J–L) showed a similar staining pattern to that of WT control mice (A–C), indicating that astrocytic iNOS expression is not over-expressed in Tg mice after ALF. Scale bar = 50 µm.

