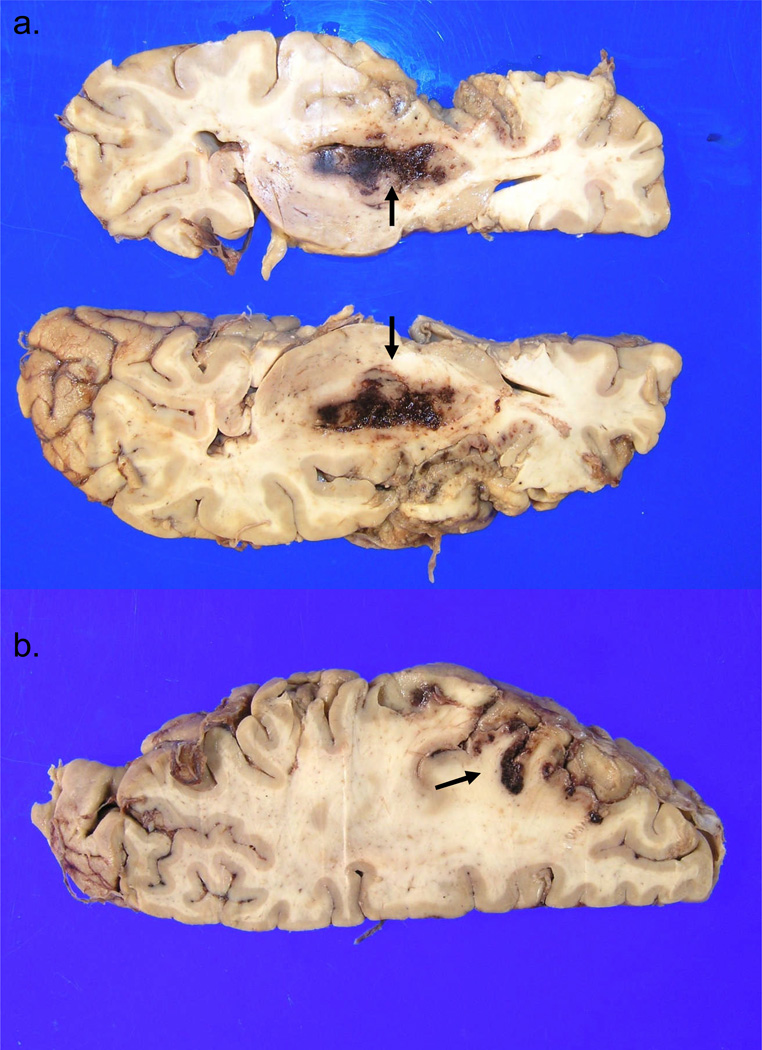
FIGURE 10.
Case #5. Panel A. Axial section of fixed left cerebral hemisphere shows large acute hematoma in the left basal ganglia (arrows), the site of severe hypertensive microvascular disease. Panel B (left cerebral hemisphere) shows extensive left MCA territory subacute infarct. Arrow indicates a prominently hemorrhagic segment of the infarct. Note relative preservation of the left ACA territory (bottom right of the photograph).

