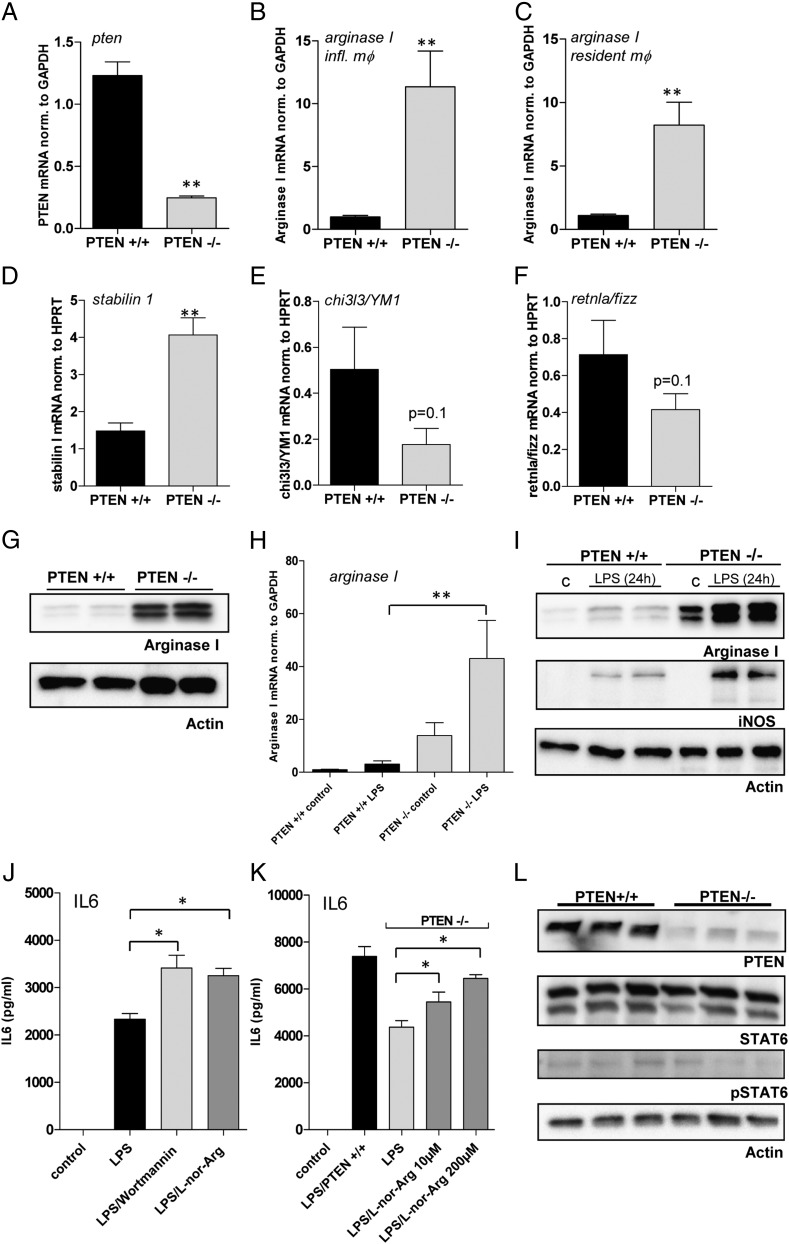
FIGURE 1.
Loss of PTEN leads to a significant increase in Arginase I expression. (A–F) Quantitative real-time analysis of unstimulated PTEN−/− and WT control macrophages. RNA was isolated from tPMs or resident macrophages, and quantitative PCR was performed with (A) PTEN, (B and C) Arginase I, (D) Stabilin1, (E) YM1, and (F) Fizz-specific primers. Target genes were normalized to GAPDH or HPRT as indicated. (G) Western blot analysis of unstimulated PTEN−/− and PTEN+/+ macrophages with Abs specific for Arginase I and β-actin. (H) Quantitative real-time analysis of Arginase I levels in PTEN−/− and PTEN+/+ macrophages 8 h after stimulation with LPS (100 ng/ml). (I) Western blot analysis of PTEN−/− and PTEN+/+ macrophages 24 h poststimulation with LPS. Blots were probed with Abs specific for Arginase I, iNOS, and β-actin. (J and K) tPMs of WT or PTEN−/− mice were stimulated with LPS and treated with the PI3K inhibitor wortmannin (100 nM) or the Arginase inhibitor N-hydroxy-nor-l-arginine (l-nor-Arg) at the indicated concentrations overnight. IL-6 levels were measured by means of ELISA. (L) Naive tPMs of PTEN−/− or WT control mice were subjected to immunoblotting. Levels of PTEN, STAT6, phosphorylated STAT6, and β-actin, as loading control, were determined by Western blot analysis. *p < 0.05, **p < 0.01. Data are representative of three individual experiments (error bars represent SD).

