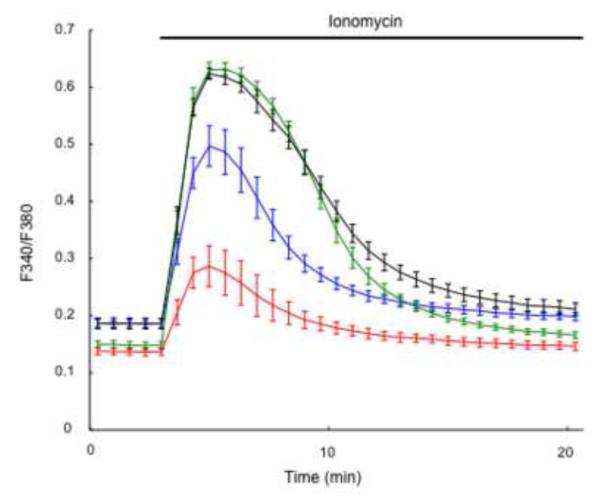
Fig. 2.
[Ca2+]ER content increases during mouse oocyte maturation. [Ca2+]ER was estimated from the [Ca2+]i responses induced by the addition of 2 μM ionomycin under Ca2+ free conditions. The mean fluorescent peak (Fura-2) was compared at 0 (red), 4 (blue), 8 (green) and 12 (black) hr of in vitro maturation, which corresponded with GV, GVBD, MI and MII stages of meiotic progression (n=5).

