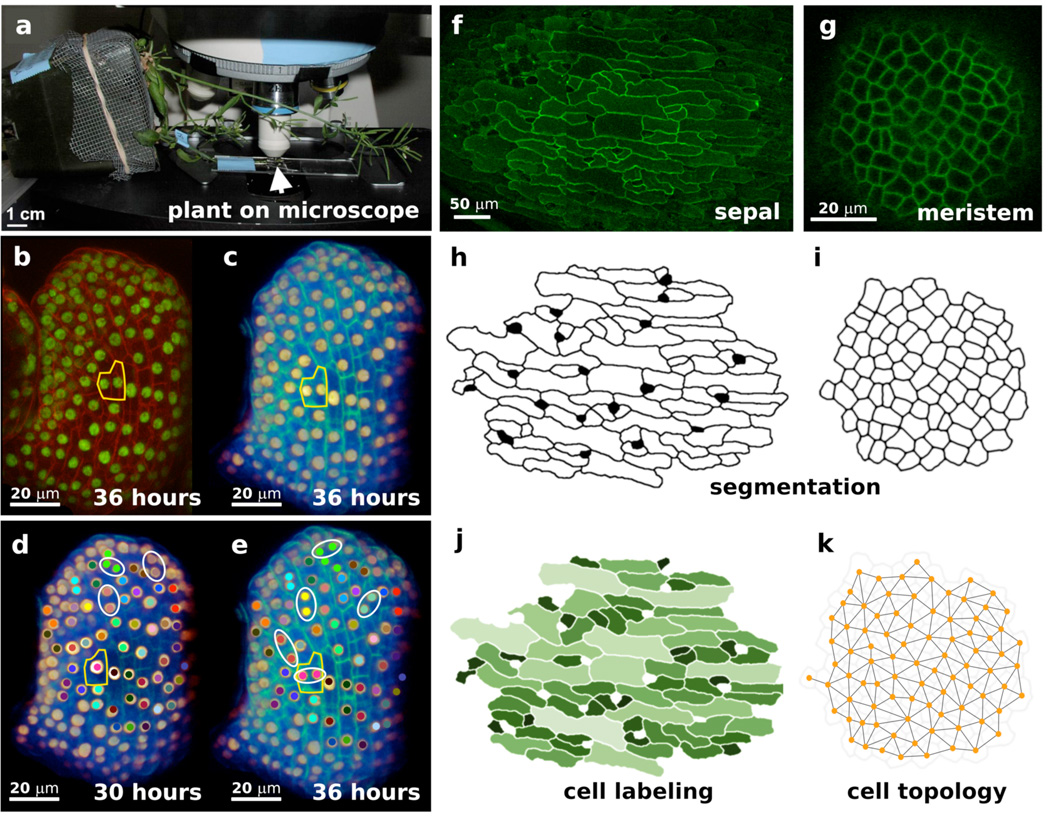
Figure 2.
Live imaging and image processing. (a) To live image the sepals, the inflorescence (arrow) was taped to a slide and mounted under a cover slip in water. The whole plant was tipped on its side in a covered pot such that the inflorescence was positioned to observe the side of the sepal. (b–e) Live imaging was used to examine the cell division pattern in loss of giant cells from organs (lgo) mutant sepals. The epidermal nuclei (ATML1::H2B-mYFP) and cell walls (Propidium iodide) were fluorescently labeled. The sepal was imaged every 6 hours for 78 hours. The cells from the pink lineage were outlined in yellow in all images. (b) A projection view of the lgo-1 mutant sepal at the 36-hour time-point was made using the Zeiss LSM microscope software. Nuclei are shown in green and cell walls in red. Note that the surrounding flower buds are also visible. (c) Volume rendering of the same 36-hour image in Amira®. Nuclei are shown in gold and cell walls in green. Note that the adjacent flowers have been cropped and the rotation of the sepal has been changed slightly through registration with the other sepals in the time series. (d–e)The cell lineages were manually tracked from the 30-hour (d) to the 36-hour (e) time point. Cells in a lineage were marked with the same colored dot. Daughter cells immediately after division were circled in white. Note that the pink cell at 30 hours divides horizontally to make two daughters at 36 hours. (f–k) Cells were segmented (h–i) from plasma membranes of a projection of sepal epidermal cells (f) and a confocal section of a shoot meristem (g). The segmented cells can be analyzed to determine their area (j light colors for larger cells) and their connections (k). Scale bar in A: 1 cm, B–E: 20 µm, F: 50 µm, and G: 20 µm. (Unpublished data AHKR, Marcus Heisler, AC, and EMM)

