
Figure 6.
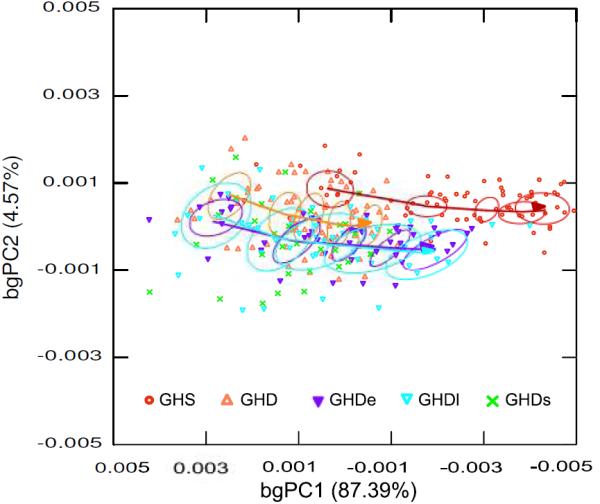
Between-age PCA (baPCA) of the ontogenetic series. The first two components account for 91.96% of variation between group means. Circles represent the centroid (0.95) of each age stage by treatment. Centroids corresponding to GHDs were not included in order to make easier the visualization of the trajectories of the GHD groups not treated and treated with GH. Arrows indicate the progression of age within each group, increasing from left to right, and show the overall ontogenetic trajectory in the shape space.