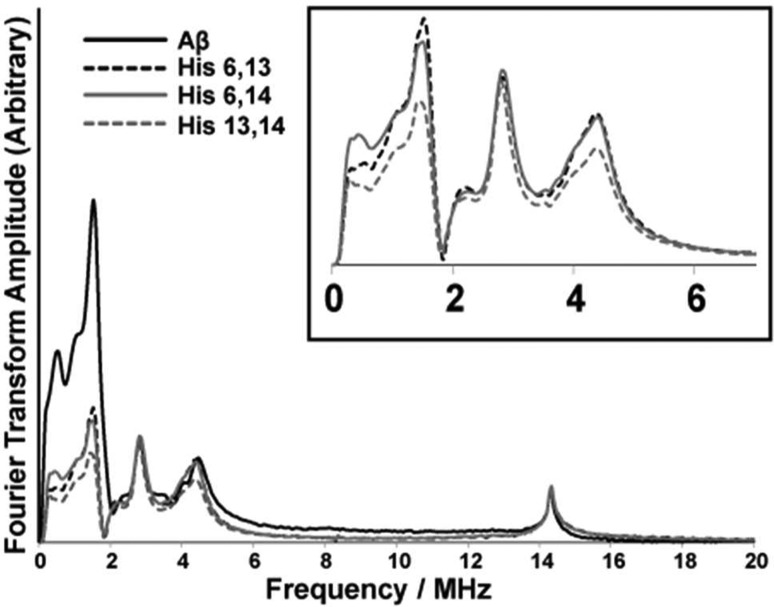
Figure 7.
Three-pulse ESEEM spectra of the nonlabeled and single 15N-labeled Aβ(1–16) variants mixed with equimolar amounts of Cu(II) at pH 8.7. The decrease in intensity below 8 MHz in 15N-labeled Aβ(1–16) variants gives the contribution of each histidine residue for component I in Aβ(1–16)–Cu(II). The inset shows an expanded view of the 0–6 MHz region for the labeled peptides.

