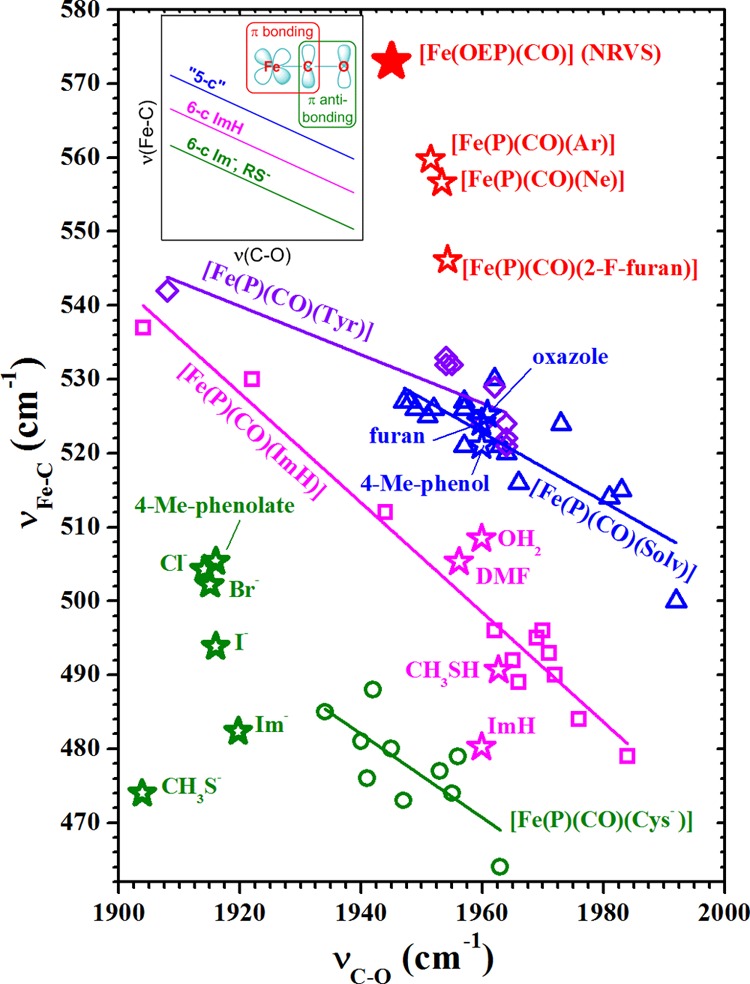
Figure 2.

Backbonding correlation plot showing the position of [Fe(OEP)(CO)] (solid red star, νCO from FTIR)15 with its uniquely high experimental νFe–C frequency, which along with 2-F-furan, Ne and Ar (open red stars), lies well above the correlation lines shown in the inset backbonding scheme. The open round (green, anionic), square (magenta, neutral), and triangular (blue, trans-O-bound) points were taken from ref (9). The diamond (violet, trans-Tyr) points are Tyr-liganded proteins.7,18 The νFe–C and νC–O frequencies for the trans-ligands next to the open star-shaped points were calculated via DFT [B3LYP/6-311G(d,p)]19 in this study. Frequencies were scaled to those of [Fe(OEP)(CO)]. Table S3 lists unscaled νFe–C and δFeCO. Scaling factors given in text.
