
Figure 3.
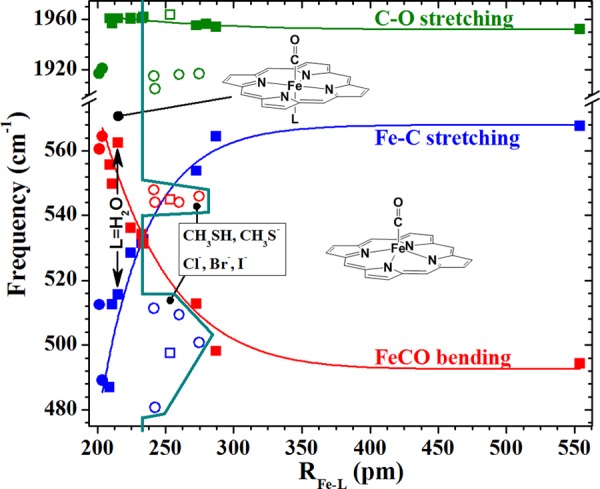
Calculated Fe–C stretching (blue), FeCO bending (red), and C–O stretching (green) frequencies, showing correlations with calculated trans-Fe–L bond distances. Neutral and anionic ligands are indicated by squares and circles, respectively. Solid points indicate ligands that coordinate through atoms from the second row of the periodic table. Ligands having coordinating atoms from the third to fifth rows are shown by open symbols. Negative charge significantly reduces the otherwise nearly invariant νC–O frequencies but has little effect on the correlation of νFe–C and δFeCO. Heavy atom ligands are shown as open points. Frequencies and RFe–L values are listed in Table S3. The turquoise line marks RFe–L at the bend–stretch crossover and extends around the heavier-atom ligands to show that they form 6-c heme carbonyls, albeit on different, but currently indeterminant trend lines.