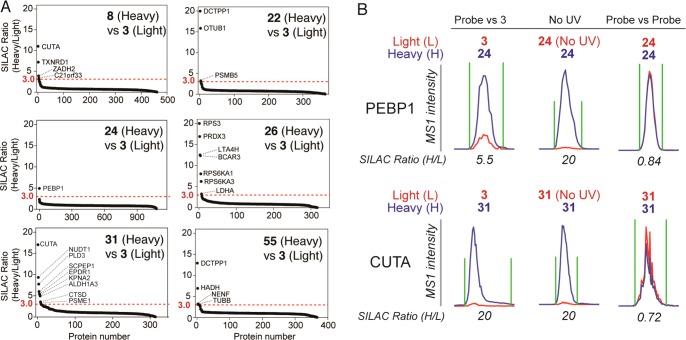
Figure 3.
Quantitative proteomic data for representative targets of the probe library. (A) SILAC plots for total proteins identified in experiments comparing cells treated with test probe (8, 22, 24, 26, 31, and 55) versus 3 (10 μM probes, 30 min). Proteins with median SILAC ratios ≥3 (test probe/3) are designated as preferred targets of the test probe (red dashed line marks 3-fold enrichment). Results are a combination of duplicate proteomic experiments performed in PC3 cells. See Table S1 for full proteomic data sets. (B) Representative MS1 peptide traces for protein targets of probes 24 (PEBP1) and 31 (CUTA) in experiments comparing the test probes to probe 3 (“probe vs 3”), to no-UV-light controls (“no UV”), and to themselves (“probe vs probe”). SILAC ratios ≥20 are reported as 20. SILAC ratios are shown as heavy:light.

