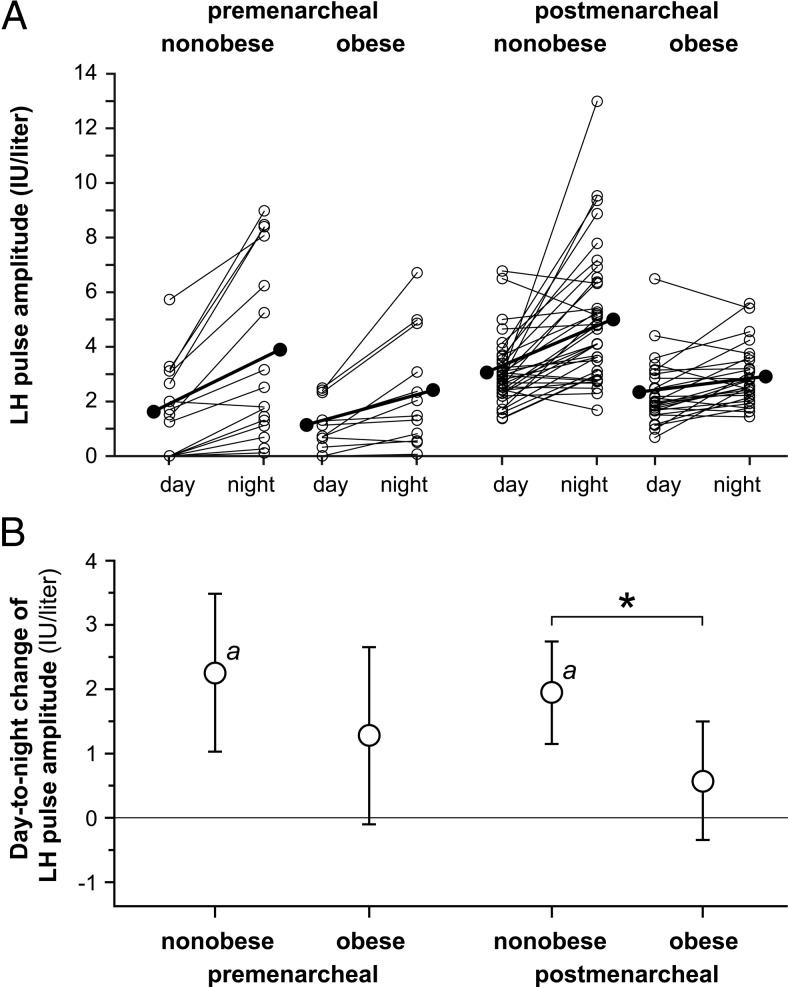
Figure 3.
Day-to-night changes in LH pulse amplitude in peripubertal girls partitioned by menarcheal and obesity statuses. A, Daytime and nighttime LH pulse amplitude, with individual subject data shown as open circles and means shown as solid circles. B, Absolute day-to-night change in LH pulse amplitude with Bonferroni-adjusted 95% confidence limits. a, Bonferroni-corrected P < .05 for day-to-night change within a group; *, Bonferroni-corrected P < .05 for comparison of day-to-night changes between groups.

