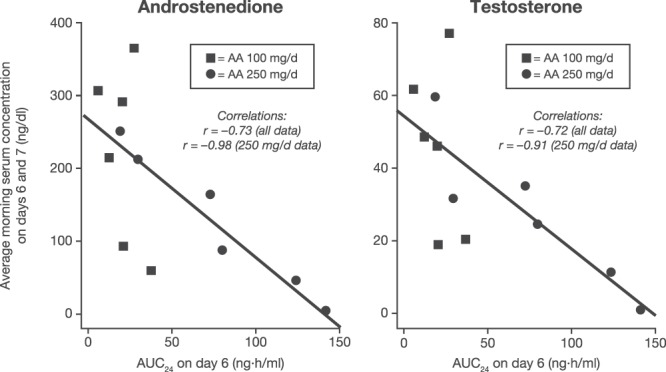
Figure 4.

Pharmacokinetic/pharmacodynamic correlation during abiraterone acetate therapy. Mean serum concentrations of androstenedione (left panel) and T (right panel) are graphed as a function of area under the curve (AUC) over 24 hours (AUC24) for plasma abiraterone concentration on day 6 of treatment periods (squares, 100 mg/d; circles, 250 mg/d treatment periods). Lines are least squares fits to the data, with curve-fitting statistics shown in insets. AA, abiraterone acetate.
