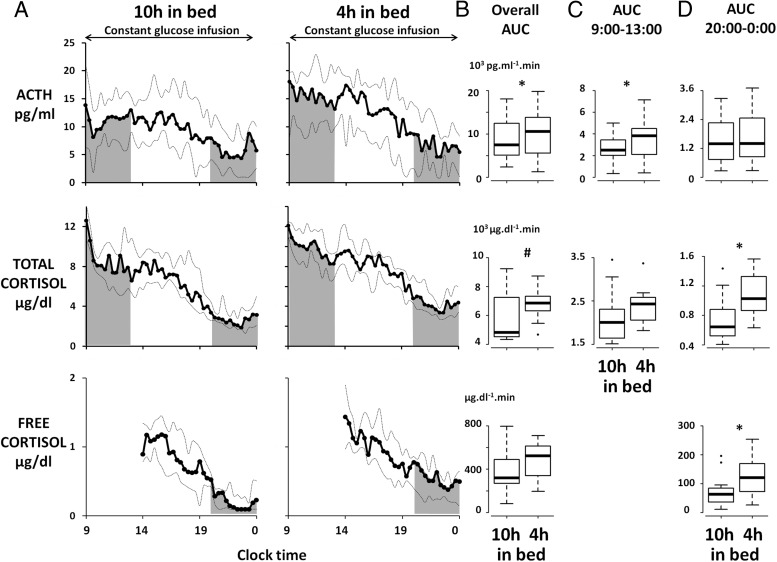
Figure 2.
A, Plasma ACTH, serum total cortisol, and salivary free cortisol profiles after 2 nights of 10 hours in bed (left panels) and after 2 nights of 4 hours in bed (right panels). The solid lines represent the median, the dotted lines represent quartiles 1 and 3. B, AUC of plasma ACTH, serum total cortisol, and salivary free cortisol for the entire sampling period (overall AUC, 9:00 am to midnight for plasma ACTH and serum total cortisol and 2:00 pm to midnight for salivary free cortisol). C, AUC of plasma ACTH and serum total cortisol between 9:00 am and 1:00 pm (morning AUC). D, AUC of plasma ACTH, serum total cortisol, and salivary free cortisol between 8:00 pm and midnight (evening AUC). *, P < .05; #, P < .10.

