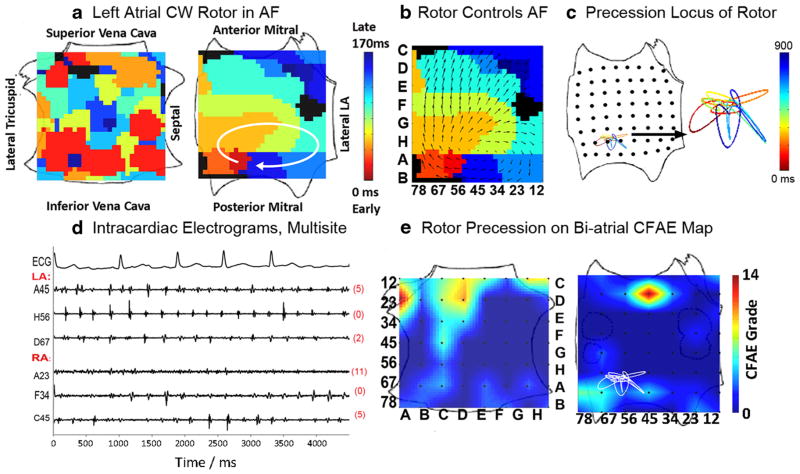
Fig. 2.
Stable left atrial fibrillation (AF) rotor overlying minimal complex fractionated atrial electrograms (CFAE). (a) Left atrial rotor during AF (time bar=1 second), which (b) controls the direction of activation in surrounding atrium. (c) The path (locus) undertaken by rotor precession, with a color-coded time line. (d) Electrograms showing low CFAE score (=6) at the rotor site, referenced to (e). (e) Locus of AF rotor precession superimposed upon a CFAE map, demonstrating that the rotor overlies only a low-grade CFAE (yellow, 4–6). Adapted with permission from: Narayan SM, Shivkumar K, Krummen DE, Miller JM, Rappel W-J. Panoramic electrophysiological mapping but not individual electrogram morphology identifies sustaining sites for human atrial fibrillation (AF rotors and focal sources relate poorly to fractionated electrograms). Circ Arrhythm Electrophysiol. 2013;6 [59•]

