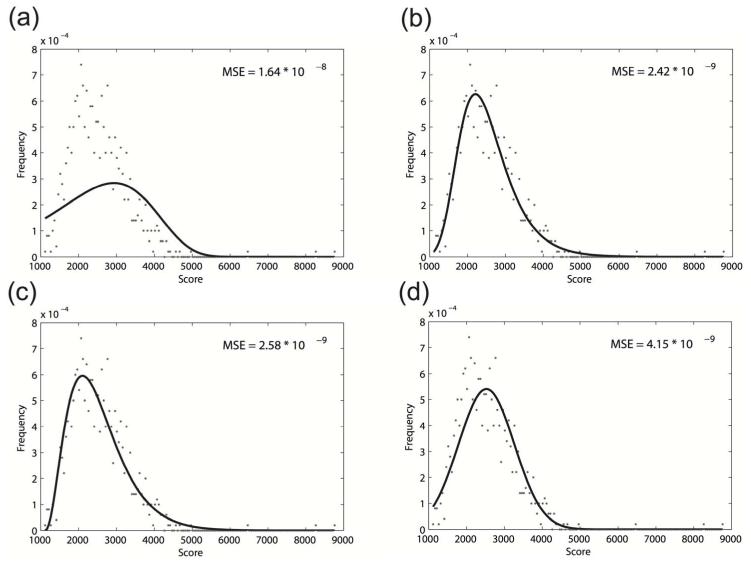
Figure 1.
The fitting of 500 5S rRNA similarity scores using different distributions. (a) Gumbel’s distribution; (b) general extreme value distribution; (c) Gamma distribution; (d) normal distribution. The Mean Square Error (MSE) is used to measure the goodness of fit. The general extreme value distribution can optimally model the local structural alignment scores

