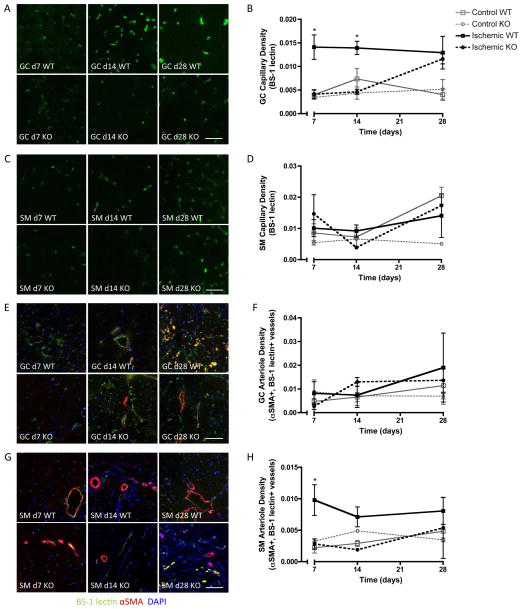
Figure 2. Immunofluorescent evaluation of microvascular capillaries and arterioles.
Shown are representative micrographs and quantification of endothelial cell (BS-1 lectin, A–D), and arteriole (αSMA+, BS1-lectin+, E–H) staining in transverse sections of gastrocnemius (GC; calf) and soleus (SM; thigh) muscles of ischemic limbs of WT and MKP-1 KO mice (N = 3–8 per time point per genotype). Capillary density was significantly lower in GC muscles of KO mice at day 7 and 14, but equivalent to WT at day 28, while arteriole density was lower in SM muscles of KO mice at day 7. *p ≤ 0.05 vs. KO at same time point. Scale bar: 25 μm.

