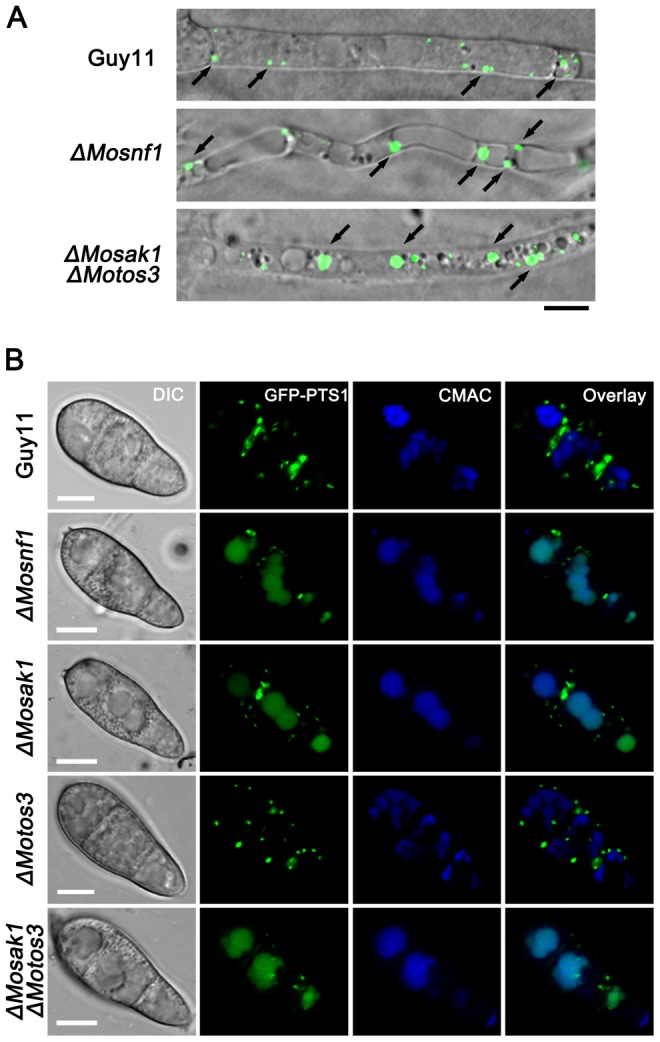
Figure 5. Effects of SNF1 pathway mutations on GFP-PTS1 distribution.

(A) Confocal microscopic observation of mutant strains expressing GFP-PTS1. Images shown were representative of the majority of vegetative hyphae. Enlarged peroxisomes were more frequently observed in ΔMosnf1 and ΔMosak1ΔMotos3 than WT. Arrows point to peroxisomes. Bar = 5 µm. (B) Colocalization of GFP-PST1-positive peroxisomes and CMAC-stained vacuoles. The amount of cytoplasmic peroxisomes was decreased dramatically in the conidia of ΔMosnf1, ΔMosak1, and ΔMosak1ΔMotos3, while in WT and ΔMotos3, numerous peroxisomal puncta were observed with the absence of vacuolar GFP fluorescence. The localization patterns of GFP-PTS1 in ΔMosip2 and ΔMosnf4 conidia were indistinguishable from that in ΔMosnf1 conidia. Bars = 5 µm.
