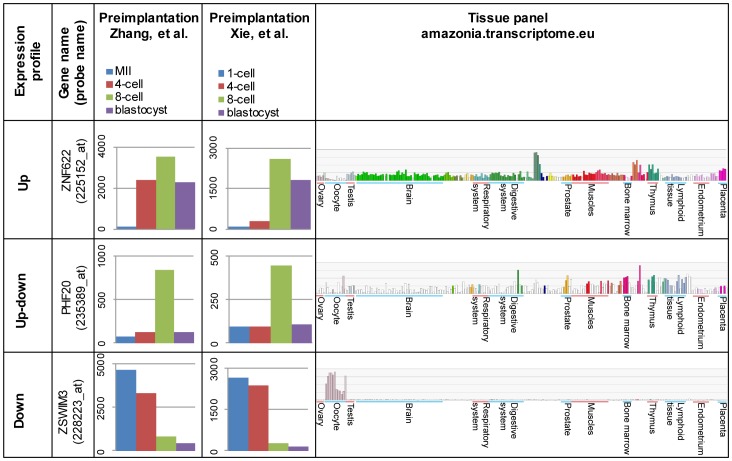
Figure 1. Examples of genes from the three different expression profile clusters.
Three different expression profiles are shown for three genes: “Up” (ZNF622), “Up-down” (PHF20) and “Down” (ZSWIM3). Average gene expression from normalized arrays are shown for two independent preimplantation microarray sets: Zhang et al. (2009) and Xie et al. (2010). Expression for various human tissues from Amazonia database show typical examples of selected genes. The larger groups of tissues are labeled, more information about the samples can be found from Amazonia database http://amazonia.transcriptome.eu/. Selected genes in the cluster “Down” display high expression in oocytes and low expression in various other human tissues.

