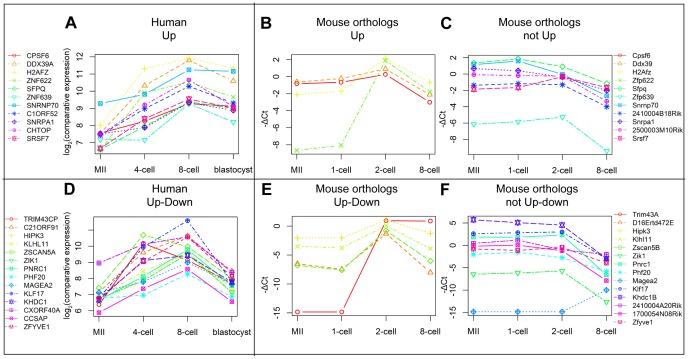
Figure 3. Comparison of early upregulated genes in human and mouse.
Expression values for the genes in cluster “Up” for humans (A) and their orthologs in mouse show similar (B) and different (C) expression pattern between the two organisms. The “Up-down” cluster genes in human (D) and their mouse orthologs also show similar (E) and different (F) expression pattern. Similarly expressed orthologs were upregulated (p-value <0.05) from 1-cell to 2-cell stages (cluster “Up”) in mouse and downregulated from 2-cell to 8-cell stages (cluster “Up-down”) with the exception of Trim 43a which was only up-, but not downregulated. Maternal expression pattern was observed for differently behaving orthologs (C, F), which were downregulated by the 8-cell stage with the exception of Magea2. Average log2(comparative expression) values for each stage were used for the human data obtained from Zhang et al. (2007) microarray expression dataset and average −ΔCt values were used for the mouse expression data produced in the current study. Undetected samples were attributed the −ΔCt value of −14.8.

