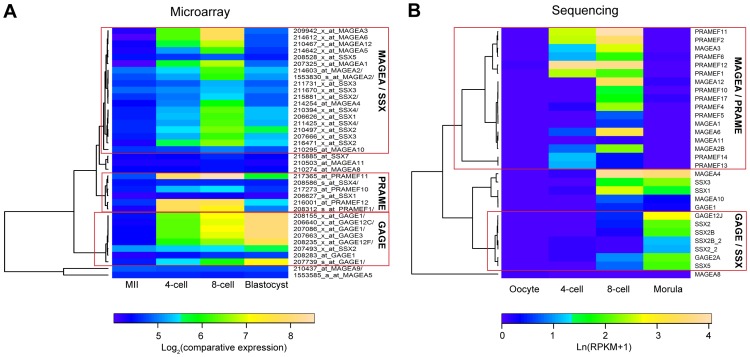
Figure 5. Expression of cancer-testis antigen family members in human preimplantation development.
Human microarray data shows clustering of MAGEA/SSX and PRAME families into Up-down expression pattern (A). Sequencing dataset shows overall similar expression pattern for these families (B). GAGE family members are upregulated at later stages in the preimplantation embryo in both datasets. The microarray results are displayed as average log2(comparative expression) and the sequencing data as average ln(RPKM+1) for similar biological stages.

