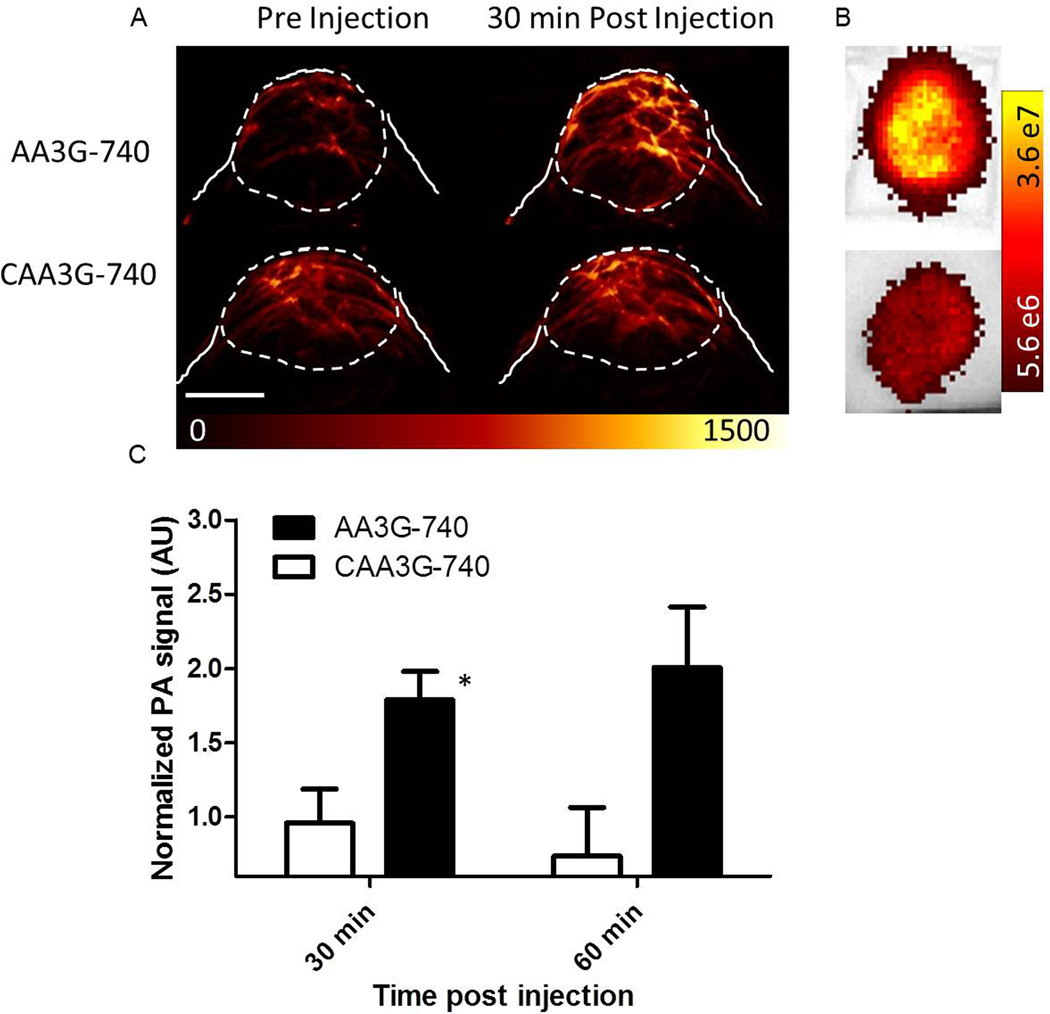
Figure 6. Imaging of GRPR in PC3 tumors.
PC3 tumors implanted in nude mice were imaged before and after the injection of 10nmol active or control agent. A) While the injection of AA3G-740 led to close to a 2 fold increase in photoacoustic signal, CAA3G-740 injection caused a minimal change over the background, pre-injection, signal. The scale bar represents 0.5 mm. B) Different accumulation of the two agents was confirmed ex vivo by optical imaging. C) The quantitation of the photoacoustic signals revealed significant difference between tumors injected with the two agents at both time points. The signal in tumors injected with AA3G-740 (n=6) increased over time, while in the ones injected with CAA3G-740 (n=4) it remained largely constant. The errors bars represent standard deviation. *p<0.05.

