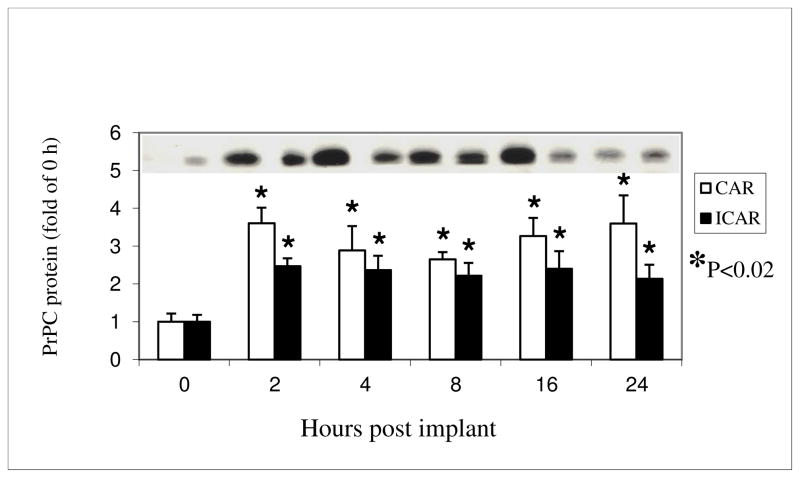
Figure 2.
Expression of PrPC protein in CAR and ICAR of E2-treated OVX ewes. Data were converted to fold-increase over 0 h (controls), which were set at 1.0. PrPC was present in both CAR and ICAR as a single protein band having a molecular weight between 30 and 45 kd. A representative membrane of the Western blots is shown on the top of the graph. The tissues and samples are shown in the same order as they are on the bar graph below. *P < 0.02; means ± S.E.M are from Western analysis.

