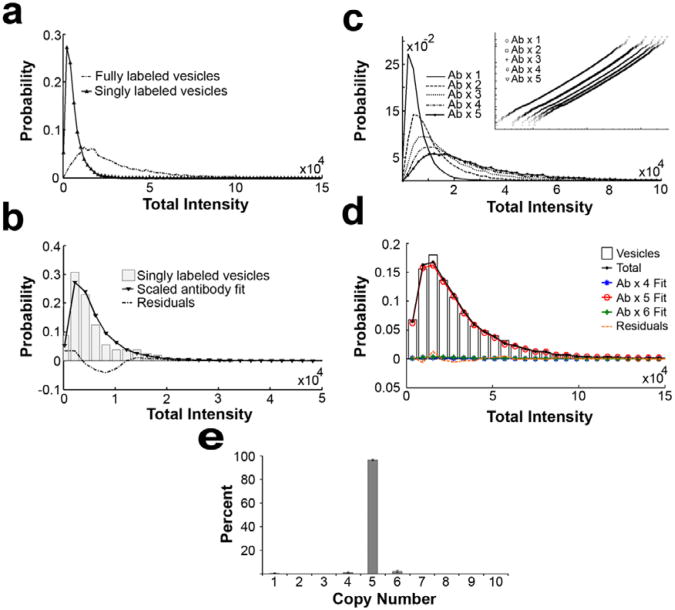
Figure 4. Deconvolution/fitting of fully labeled sample using single-antibody distribution to obtain protein copy number.
(a) Plot comparing the intensity distribution of fully labeled and singly labeled vesicles. (b) A histogram showing scaled single primary-secondary antibody complex distribution compared with singly labeled (i.e. with only one antibody per vesicle) vesicle distribution. Here, a measured single-line. (c) Plots showing the multiplication of the scaled single-antibody distribution to generate calibration curves for fitting. (d) A plot showing the fit for the protein SV2 on synaptic vesicles. The best fit was obtained with 95% of 5 proteins and 5% of 6 proteins. The small residuals of the fit (dotted line) indicate a good fit to the data. (e) Results of fitting six different SV2 data sets. (Mutch et al 2011)

