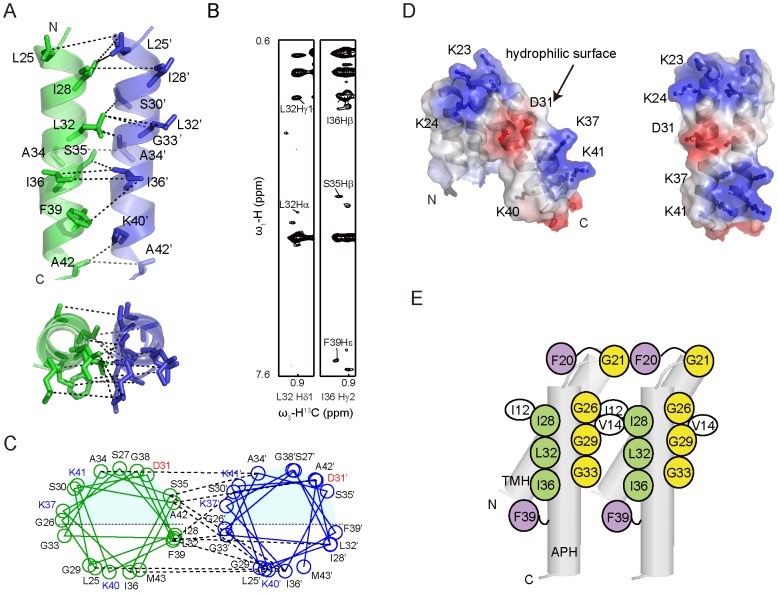
Figure 6. Interface of APH regions in dimeric TatA.
A) Dimerization interface between the APH segments of two subunits. Only APH segments are shown for clarity. The omitted TMHs are positioned below the paper. B) Representative strips from 13C/15N-filtered, 13C-edited NOESY experiment using a d-MCG-TatA sample with a mixture of uniformly 13C/15N-labeled and unlabeled MCG-TatA (mixing time 300 ms). The experiment selectively observes intermolecular NOEs as described in Figure 5. C) Structure-based helical wheel diagrams of the dimer interface, with representative NOE interactions shown in dashed lines. Positively and negatively charged residues are shown in blue and red, respectively. The helical wheel diagram was drawn using an in-house written script based on the atomic coordinates of the dimeric TatA structure. D) Surface representation of the TatA dimer with electrostatic potential. Side chains of charged residues are shown in sticks and labeled. E) A schematic summary of important residues at the TatA oligomerization surface.

