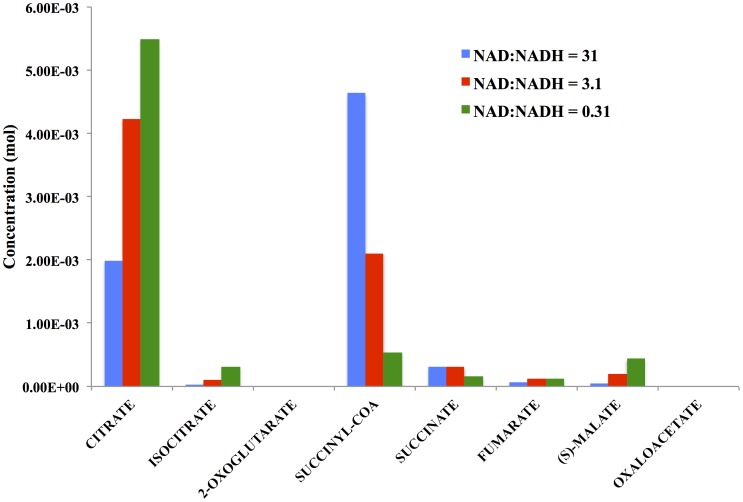
Figure 9. Predicted metabolite levels for each reaction intermediate shown in Figure 7 under conditions in which the NAD+:NADH ratio is 31 (Bennett et al. [26]), or decreased by either 0.1-fold or 0.01-fold.
The compounds with the lowest mean concentrations have the highest variability. The coefficients of variation for 1000 simulation steps are (from high to low): oxaloacetate, 1.60e–02; 2-oxoglutarate, 1.66e–02; succinate, 1.10e–05; fumarate, 2.30e–05; isocitrate, 5.15e–06; malate, 5.20e–06; citrate, 2.73e–07; succinyl-CoA, 5.81e–08.

