
Figure 3. FT-Raman spectra (amide I region: 1590–1720 cm−1) of fibrillar aggregates from TDP-43 C-terminal fragments including (a) D1, (b) G294V, (c) G295S, (d) G294P, and (e) GGG294PPP.
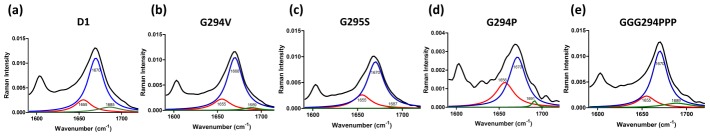
The black line corresponds to the original spectrum. The red, blue, and green lines represent the individual component of α-helix, β-sheet, and random coil, respectively.