
Figure 3.
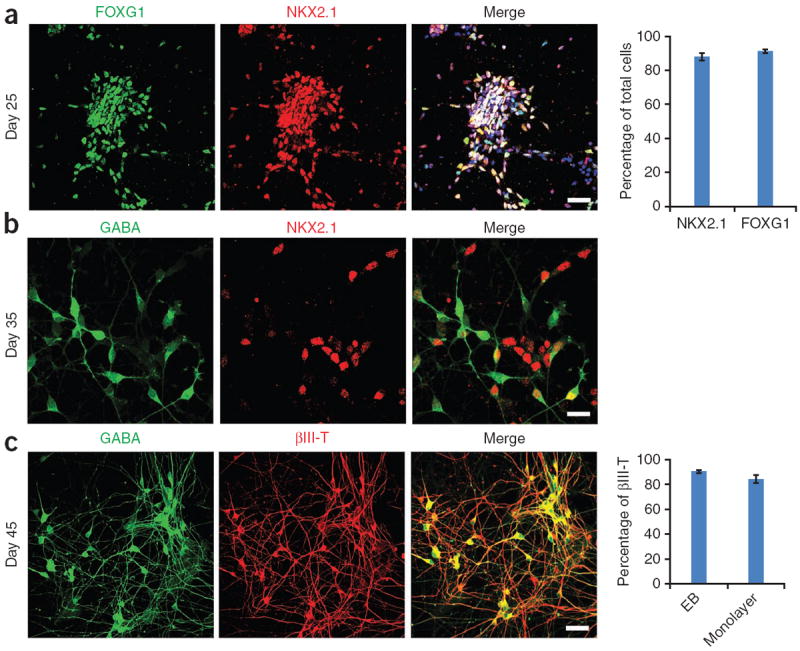
Characteristics of MGE progenitors and forebrain GABA interneurons. (a) At day 25, nearly all the cells express the forebrain marker FOXG1 (green), and the MGE marker NKX2.1 (red). Hoechst is shown in blue. Quantification is on the right; n = 5 different differentiation cultures. We counted 800–1,200 cells per replicate. Data are presented as means ± s.e.m. (b) At day 35, MGE cells (NKX2.1+; red) begin to express GABA (green), indicating that the GABA neurons are coming from the ventral forebrain area. (c) At day 45, nearly all the neurons express GABA (green). Quantification of the EB method and monolayer method is on the right; n = 5 different differentiation cultures. We counted 800–1,200 cells per replicate. Data are presented as means ± s.e.m. Scale bars, 50 μm. βIII-T, βIII-tubulin.