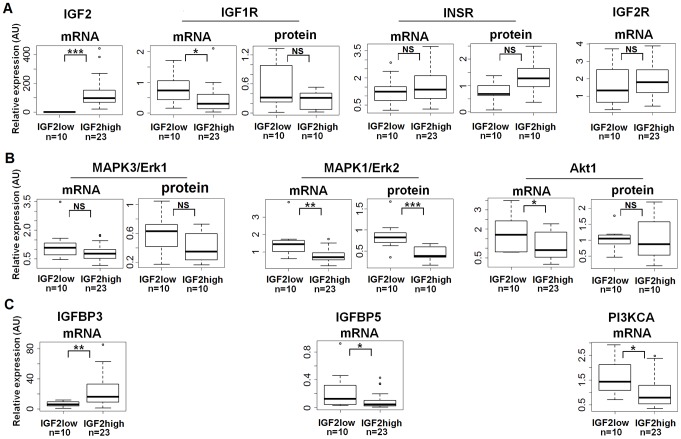
Figure 2. Quantitative expression of IGF signaling pathway members.
Boxplots showing the mRNA (quantitative RT-PCR) and/or protein (western blot) levels of several IGF2 pathway members in IGF2-high (n = 23 for RT-PCR and n = 10 for western blot) and IGF2-low (n = 10) ACC. Y-axis for mRNA: result of the ΔΔC T method (2-ΔΔCT value), with RNA18S5 as a reference gene. Y-axis for protein: results of the quantification of the western blot bands, normalized to actin. Wilcoxon test results (*p<0.05; **p<0.01; ***p<0.00; NS = not significant) are indicated for each mRNA or protein studied. A: IGF2 and its receptors. B: Erk and Akt. C: other IGF2 pathway members with significantly different expression between IGF2-high and IGF2-low ACC.

