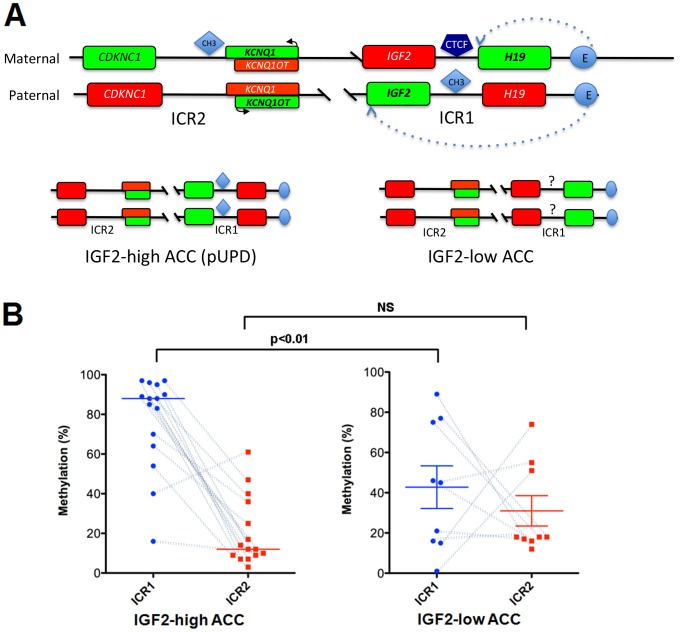
Figure 5. Structure and methylation of the 11p15 locus.
A. Schematic representation of the 11p15 locus. The 11p15 locus is represented with the 2 differentially imprinted regions (ICR1 & ICR2). In the maternal allele H19 is expressed but not IGF2 as the consequence of CTCF binding to a sequence located between the 2 genes and acting as an insulator. Therefore the enhancer (E) can only activate the transcription of the most proximal gene. The methylation (CH3) of this sequence (paternal allele) prevents the binding of CTCF, allows the expression of IGF2 and represses that of H19. The methylation (maternal allele) or not (paternal allele) of ICR2 results in the opposite expression of CDKN1C, KCNQ1 and KCNQ10T. Genes with activation or repression of their expression are indicated in green or red respectively. The most frequent patterns observed in IGF2-high (left) and IGF2-low (right) ACC are indicated in the lower part of the figure. B: Methylation of the 11p15 imprinting center regions in IGF2-high (n = 15) and IGF2-low (n = 9) ACC. The percentage of methylation (y-axis) is shown for ICR1 (blue circles) and ICR2 (red squares). Wilcoxon test results (**p<0.01; NS = not significant) are indicated. Dotted lines connect data from the same tumor, and indicate paternal uniparental disomy (pUPD) when ICR1 is highly methylated and ICR2 is weakly methylated. This pUPD pattern is present in almost all IGF2-high ACC, whereas it is present in only three out of nine IGF2-low ACC.

