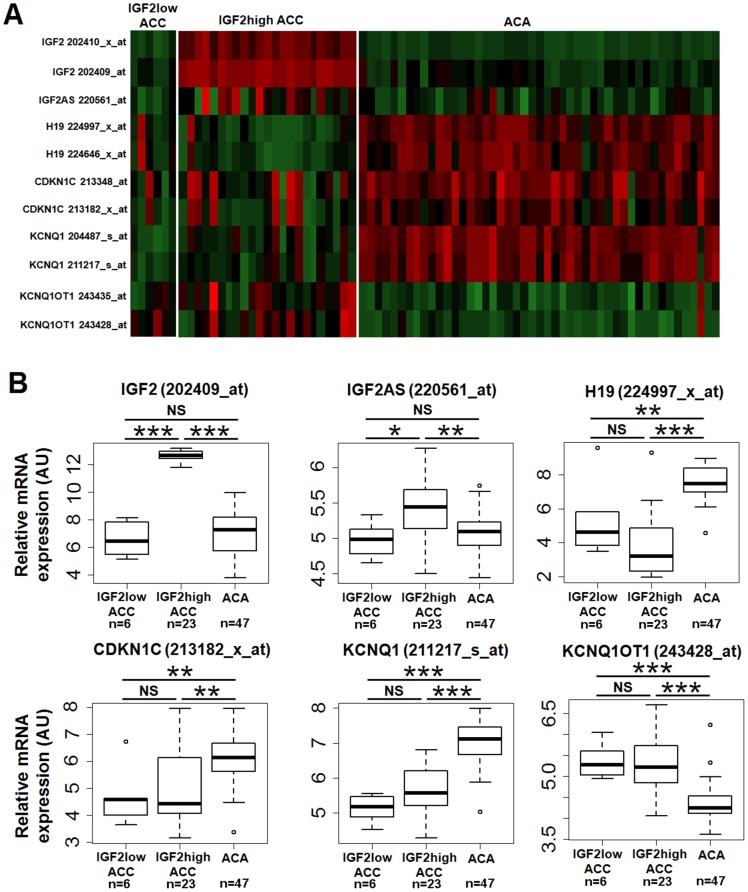
Figure 6. Expression of the genes in the 11p15 imprinted region.
A: Snapshot heat map of the 11p15 chromosomal region generated from a previous transcriptomic study (21). Expression levels of imprinted genes IGF2, IGF2AS, H19, CDKN1C, KCNQ1, and KCNQ1OT1 are shown for 47 ACA, six IGF2-low ACC and 23 IGF2-high ACC. Red: high expression. Green: low expression. B: Boxplots showing expression data for the same genes. Wilcoxon test results (*p<0.05; **p<0.01; ***p<0.001; NS = not significant) are indicated. Except for IGF2 and IGF2AS, there are no significant differences between IGF2-high and IGF2-low ACC.

