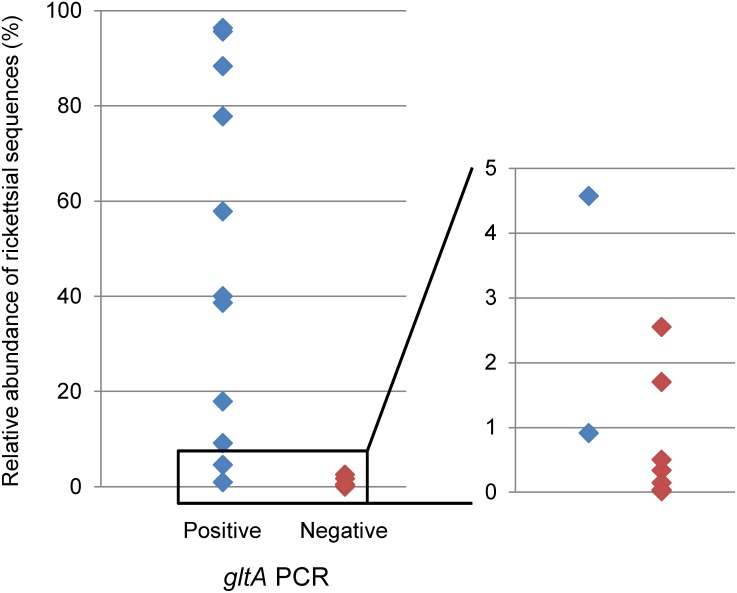
Figure 5. Comparison of the relative abundance of rickettsial sequences estimated by 16S amplicon analysis and the results of gltA PCR.
Vertical axis represents the relative abundance of rickettsial sequences calculated from the data obtained from 16S amplicon analysis. Blue dots represent samples in which Rickettsia was detected by both 16S amplicon analysis and gltA PCR. Red dots represent samples in which Rickettsia was detected by 16S amplicon analysis but not by gltA PCR. The plots with relative abundance values between 0% and 5% are shown in the magnified graph provided in the right column.

