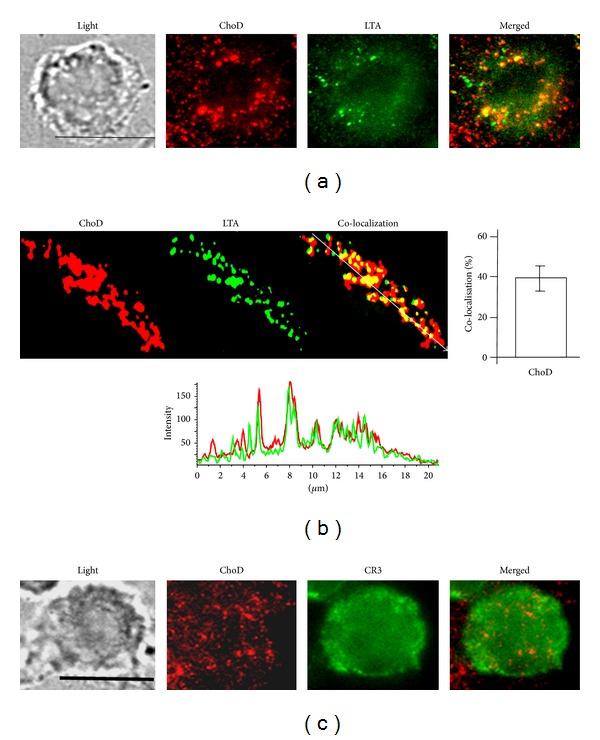
Figure 4.

Determination of ChoD binding to LTA-binding sites in THP-1-derived macrophages. Macrophages were incubated with ChoD (0.5 U/mL) and LTA (100 μg/mL) for 30 min. After fixation with 4% PFA, cells were evaluated using a Nikon Eclipse TE 2000-U microscope. At least 10 fields were analyzed per slide (100x objective; scale bar = 10 μm). Three independent experiments were carried out. (a) Fluorescence of double-labeled macrophages after incubation with ChoD (PE-antibody staining, red) and LTA (FITC-antibody staining, green). The merged image shows extensive overlay of areas positive for ChoD and LTA (yellow). (b) Enlarged fluorescence images of the representative region of colocalization. Individual markers are shown in red (ChoD) and green (LTA). Merged image showing colocalization of LTA and ChoD staining (yellow) is shown in the panel at right. Graph at right shows mean value ± SEM of the percent of ChoD areas that colocalize with LTA (six individual regions of evident colocalization per slide; three independent experiments). Graph below shows fluorescence-intensity profiles of ChoD (red) and LTA (green) in a cross-section (denoted by an arrow on the merged image), demonstrating excellent colocalization. (c) Representative image of cell shows lack of colocalization of ChoD and CR3.
