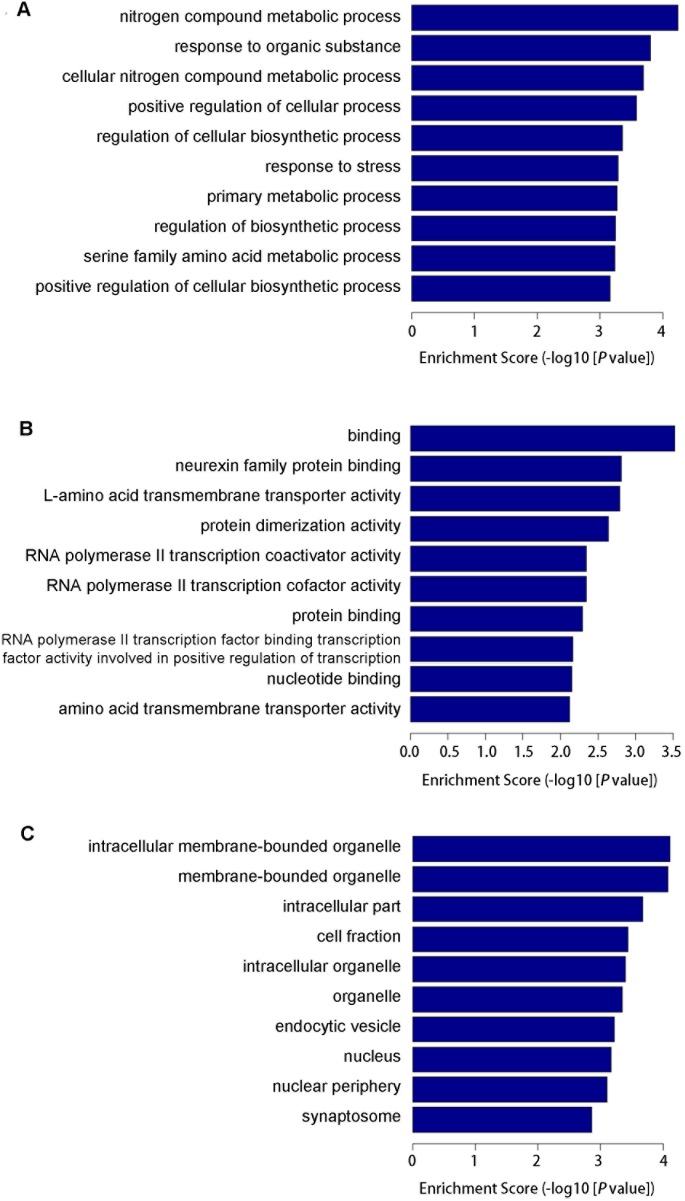
Figure 4. Classifications of predicted target genes according to their gene ontology (GO) annotation terms within biological process (A), molecular function (B) and cellular component (C) ontologies, respectively.
These GO terms showed a statistically significantly enriched representation. Enrichment Score of the GO equals (-log10 [P-value]).

