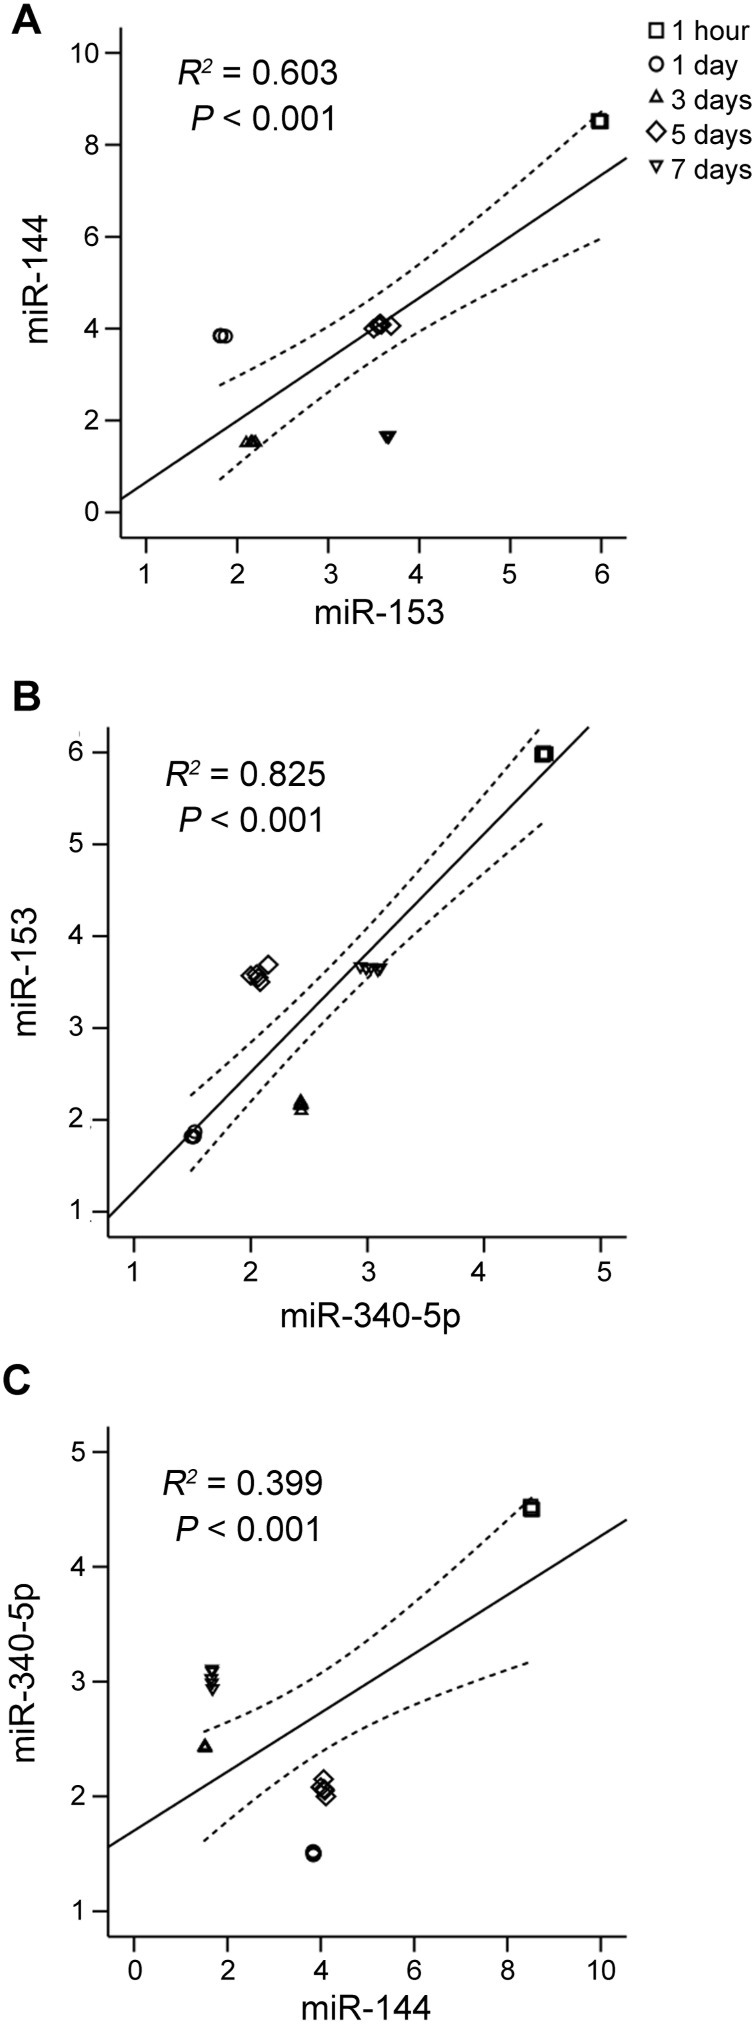
Figure 6. Correlation analyses between miR-144 and miR-153 (A), miR-153 and miR-340-5p (B) or miR-144 and miR-340-5p (C).
Hippocampal miRNA levels from sham and all TBI rats were used for correlation analysis. The R2 represents correlation coefficient. The correlation is significant at the 0.01 level (2-tailed).

