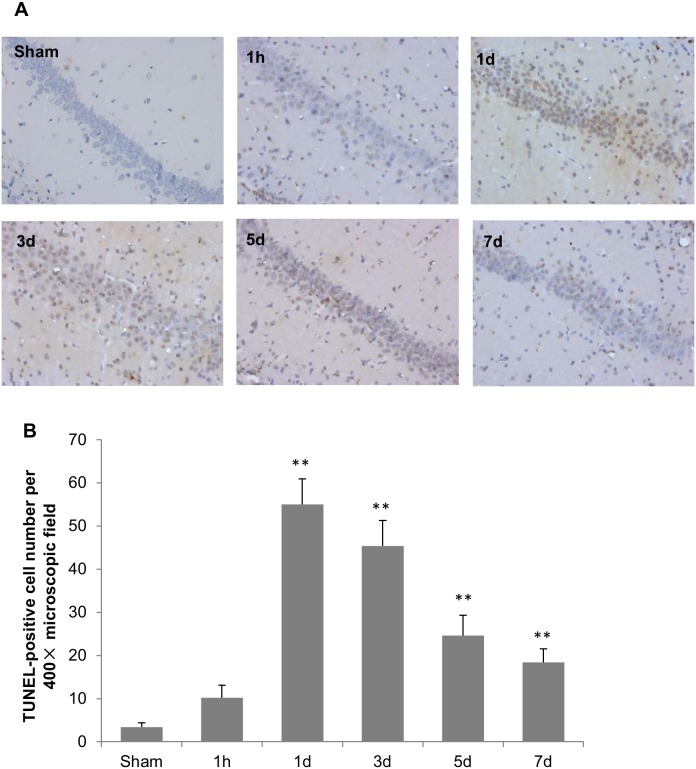
Figure 9. Histopathological analysis of TBI-induced apoptosis.
(A) TUNEL staining of the hippocampal CA1 section of sham and TBI rats (200X). (B) Average numbers of TUNEL-positive cells in hippocampal CA1 section. The stained cells were counted in four microscopic fields of each slide at a 400X magnification. Data represent means ± SEM. N = 5. *P<0.05 and **P<0.01 vs. sham group.

