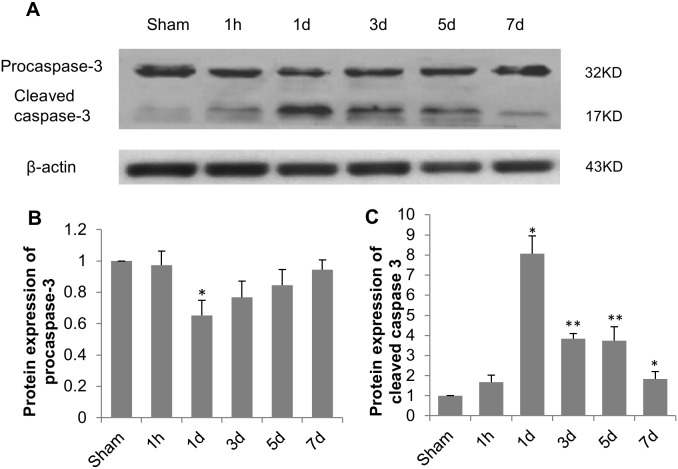
Figure 10. Caspase 3 activation in rat hippocampus after TBI.
(A) Western blot analysis of procaspase 3 and cleaved caspase 3 in hippocampus. β-actin served as loading control. Relative protein expression levels were determined by normalizing band density of procaspase 3 (B) or cleaved caspase 3 (C) to that of β-Actin and comparing with sham group. Data are presented as mean ± SEM. N = 5. *P<0.05 and **P<0.01 vs. sham group.

