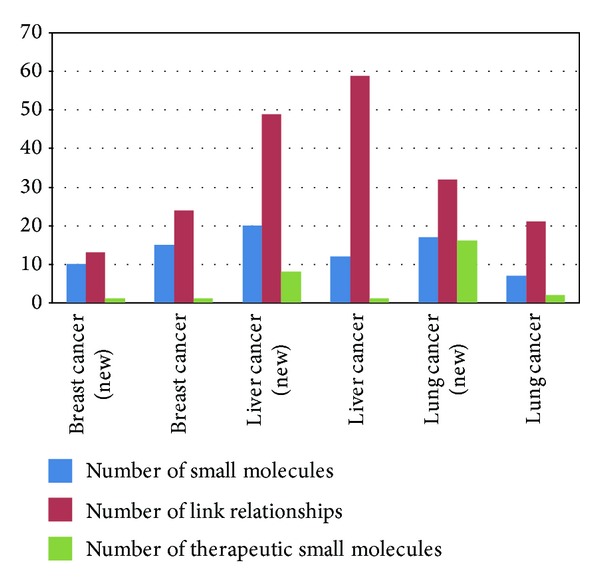
Figure 5.

A chart indicates the validated six datasets of three cancers. The blue bars represent the validated small molecules, while the red bars turn out to be the validated M-P link relationships. Besides, the green bars are the small molecules for anticancer drugs proved.
